Windstream 2014 Annual Report Download - page 126
Download and view the complete annual report
Please find page 126 of the 2014 Windstream annual report below. You can navigate through the pages in the report by either clicking on the pages listed below, or by using the keyword search tool below to find specific information within the annual report.-
 1
1 -
2
-
3
-
4
-
5
-
6
-
7
-
8
-
9
-
10
-
11
-
12
-
13
-
14
-
15
-
16
-
17
-
18
-
19
-
20
-
21
-
22
-
23
-
24
-
25
-
26
-
27
-
28
-
29
-
30
-
31
-
32
-
33
-
34
-
35
-
36
-
37
-
38
-
39
-
40
-
41
-
42
-
43
-
44
-
45
-
46
-
47
-
48
-
49
-
50
-
51
-
52
-
53
-
54
-
55
-
56
-
57
-
58
-
59
-
60
-
61
-
62
-
63
-
64
-
65
-
66
-
67
-
68
-
69
-
70
-
71
-
72
-
73
-
74
-
75
-
76
-
77
-
78
-
79
-
80
-
81
-
82
-
83
-
84
-
85
-
86
-
87
-
88
-
89
-
90
-
91
-
92
-
93
-
94
-
95
-
96
-
97
-
98
-
99
-
100
-
101
-
102
-
103
-
104
-
105
-
106
-
107
-
108
-
109
-
110
-
111
-
112
-
113
-
114
-
115
-
 116
116 -
 117
117 -
 118
118 -
 119
119 -
 120
120 -
 121
121 -
 122
122 -
 123
123 -
 124
124 -
 125
125 -
 126
126 -
 127
127 -
 128
128 -
 129
129 -
 130
130 -
 131
131 -
 132
132 -
 133
133 -
 134
134 -
 135
135 -
 136
136 -
137
-
138
-
139
-
140
-
141
-
142
-
143
-
144
-
145
-
146
-
147
-
148
-
149
-
150
-
151
-
152
-
153
-
154
-
155
-
156
-
157
-
158
-
159
-
160
-
161
-
162
-
163
-
164
-
165
-
166
-
167
-
168
-
169
-
170
-
171
-
172
-
173
-
174
-
175
-
176
-
177
-
178
-
179
-
180
-
181
-
182
-
183
-
184
-
185
-
186
-
187
-
188
-
189
-
190
-
191
-
192
-
193
-
194
-
195
-
196
-
197
-
198
-
199
-
200
-
201
-
202
-
203
-
204
-
205
-
206
-
207
-
208
-
209
-
210
-
211
-
212
-
213
-
214
-
215
-
216
 |
 |

F-10
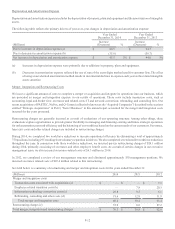
Cost of Services
Cost of services expense primarily consists of charges incurred for network operations, interconnection, bad debt and business
taxes. Network operations charges include salaries and wages, materials, contractor costs, IT support and costs to lease certain
network facilities. Interconnection consists of charges incurred to access the public switched network and transport traffic to the
Internet, including charges paid to other carriers for access points where we do not own the primary network infrastructure. Other
expense consists of third-party ancillary voice and data services, business and financial services, bad debt and business taxes.
The following table reflects the primary drivers of year-over-year changes in cost of services:
Year Ended
December 31, 2014
Year Ended
December 31, 2013
(Millions)
Increase
(Decrease) %
Increase
(Decrease) %
Due to changes in pension and postretirement expense (a) $ 203.4 $ (155.3)
Due to changes in federal USF expenses (b) 18.7 (13.3)
Due to increases in network operations (c) 15.1 44.4
Due to changes in interconnection expense (d) 9.4 (53.9)
Due to decreases in other expenses (19.4)(22.0)
Net changes in cost of services $ 227.2 9% $ (200.1)(7)%
(a) The increase in pension and postretirement expense in 2014 was primarily attributable to a net actuarial loss of $128.6
million, of which $101.0 million was included in cost of services. The net actuarial loss resulted from a decrease in the
discount rate used to measure our pension obligations from 5.01 percent in 2013 to 4.14 percent in 2014 and changes to
our mortality assumptions reflecting longer life expectancies of plan participants. Conversely, the decrease in 2013
reflected the effects of an actuarial gain of $110.4 million primarily attributable to an increase in the discount rate to 5.01
percent in 2013 from 3.85 percent in 2012, of which $83.7 million was recorded to cost of services. Year-over-year
comparisons also reflected the effects of curtailment and settlement gains recognized in each year from the elimination
of medical and prescription subsidies for certain active and retired participants. These gains reduced cost of services by
$7.1 million in 2014 compared to $24.1 million in 2013. See Note 7 to the consolidated financial statements for additional
information regarding our pension and postretirement benefit plans.
(b) The increase in the federal USF contributions in 2014 was driven by an increase in the average USF contribution factor
for the year, while the decrease in 2013 was attributable to a reduction in the contribution factor compared to the prior
year.
(c) Increases in network operations were primarily due to higher leased network facilities costs attributable to expansion of
our fiber transport network and adding new data centers and increasing capacity at existing data center locations.
(d) The increase during 2014 in interconnection expense was primarily due to increased purchases of circuits due to the
growth in data customers, as well as higher capacity circuits to service existing customers and increase the transport
capacity of our network, partially offset by a reduction in long-distance usage by our customers and cost improvements
from the continuation of network efficiency projects. The decrease in 2013 was mostly attributable to the favorable impact
of network efficiency projects, rate reductions primarily driven by intercarrier compensation reform, and lower long-
distance usage by our customers.