Windstream 2014 Annual Report Download - page 210
Download and view the complete annual report
Please find page 210 of the 2014 Windstream annual report below. You can navigate through the pages in the report by either clicking on the pages listed below, or by using the keyword search tool below to find specific information within the annual report.-
 1
1 -
2
-
3
-
4
-
5
-
6
-
7
-
8
-
9
-
10
-
11
-
12
-
13
-
14
-
15
-
16
-
17
-
18
-
19
-
20
-
21
-
22
-
23
-
24
-
25
-
26
-
27
-
28
-
29
-
30
-
31
-
32
-
33
-
34
-
35
-
36
-
37
-
38
-
39
-
40
-
41
-
42
-
43
-
44
-
45
-
46
-
47
-
48
-
49
-
50
-
51
-
52
-
53
-
54
-
55
-
56
-
57
-
58
-
59
-
60
-
61
-
62
-
63
-
64
-
65
-
66
-
67
-
68
-
69
-
70
-
71
-
72
-
73
-
74
-
75
-
76
-
77
-
78
-
79
-
80
-
81
-
82
-
83
-
84
-
85
-
86
-
87
-
88
-
89
-
90
-
91
-
92
-
93
-
94
-
95
-
96
-
97
-
98
-
99
-
100
-
101
-
102
-
103
-
104
-
105
-
106
-
107
-
108
-
109
-
110
-
111
-
112
-
113
-
114
-
115
-
116
-
117
-
118
-
119
-
120
-
121
-
122
-
123
-
124
-
125
-
126
-
127
-
128
-
129
-
130
-
131
-
132
-
133
-
134
-
135
-
136
-
137
-
138
-
139
-
140
-
141
-
142
-
143
-
144
-
145
-
146
-
147
-
148
-
149
-
150
-
151
-
152
-
153
-
154
-
155
-
156
-
157
-
158
-
159
-
160
-
161
-
162
-
163
-
164
-
165
-
166
-
167
-
168
-
169
-
170
-
171
-
172
-
173
-
174
-
175
-
176
-
177
-
178
-
179
-
180
-
181
-
182
-
183
-
184
-
185
-
186
-
187
-
188
-
189
-
190
-
191
-
192
-
193
-
194
-
195
-
196
-
197
-
198
-
199
-
 200
200 -
 201
201 -
 202
202 -
 203
203 -
 204
204 -
 205
205 -
 206
206 -
 207
207 -
 208
208 -
 209
209 -
 210
210 -
 211
211 -
 212
212 -
 213
213 -
 214
214 -
 215
215 -
 216
216
 |
 |

NOTES TO CONSOLIDATED FINANCIAL STATEMENTS
____
F-94
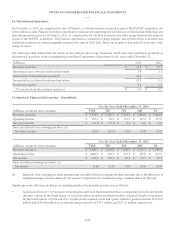
14. Discontinued Operations:
On December 5, 2013, we completed the sale of Pinnacle, a software business acquired as part of the PAETEC acquisition, for
$30.0 million in cash. Pinnacle provided comprehensive solutions for supporting the full lifecycle of information technology and
telecommunications services. On June 15, 2012, we completed for $6.1 million in cash the sale of the energy business also acquired
as part of the PAETEC acquisition. This business operated as a competitive energy supplier and sold electricity to business and
residential customers in certain geographic regions in the state of New York. There was no gain or loss realized on the sale of the
energy business.
The following table summarizes the results of the software and energy businesses which have been separately presented as
discontinued operations in the accompanying consolidated statements of operations for the years ended December 31:
(Millions) 2013 2012
Revenues and sales $ 16.9 $ 29.7
Operating income from discontinued operations 1.4 3.1
Gain on sale of discontinued operations 14.4 —
Income before tax from discontinued operations 15.8 3.1
Income tax expense 9.8 2.2
Net income from discontinued operations $ 6.0 $ 0.9
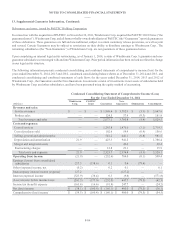
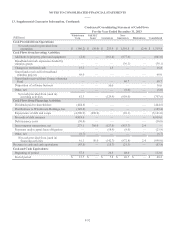
15. Quarterly Financial Information – (Unaudited):
For the Year Ended December 31, 2014
(Millions, except per share amounts) Total 4th 3rd 2nd 1st
Revenues and sales $ 5,829.5 $ 1,443.1 $ 1,455.5 $ 1,466.0 $ 1,464.9
Operating income $ 507.1 $ 20.5 $ 151.6 $ 167.2 $ 167.8
Net (loss) income $ (39.5)$ (77.5) $ 8.0 $ 14.0 $ 16.0
Basic and diluted (loss) earnings per share: (a)
Net (loss) income ($.07)($.13) $.01 $.02 $.02
For the Year Ended December 31, 2013
(Millions, except per share amounts) Total 4th 3rd 2nd 1st
Revenues and sales $ 5,988.1 $ 1,491.4 $ 1,498.5 $ 1,501.7 $ 1,496.5
Operating income $ 1,009.0 $ 326.5 $ 219.6 $ 227.0 $ 235.9
Net income $ 241.0 $ 118.4 $ 30.6 $ 39.7 $ 52.3
Basic and diluted earnings per share: (a)
Net income $.40 $.20 $.05 $.06 $.09
(a) Quarterly (loss) earnings per share amounts may not add to full-year earnings per share amounts due to the difference in
weighted-average common shares for the quarters compared to the weighted-average common shares for the year.
Significant events affecting our historical operating trends in the quarterly periods were as follows:
As discussed in Note 7, we recognize actuarial gains and losses for pension benefits as a component of net periodic benefit
(income) expense in the fourth quarter of each year, unless an earlier measurement date is required. Results of operations
for the fourth quarter of 2014 and 2013 include pretax actuarial losses and (gains) related to pension benefits of $128.6
million and $(110.4) million or an after-tax charge (benefit) of $79.1 million and $(71.1) million, respectively.