Windstream 2014 Annual Report Download - page 128
Download and view the complete annual report
Please find page 128 of the 2014 Windstream annual report below. You can navigate through the pages in the report by either clicking on the pages listed below, or by using the keyword search tool below to find specific information within the annual report.-
 1
1 -
2
-
3
-
4
-
5
-
6
-
7
-
8
-
9
-
10
-
11
-
12
-
13
-
14
-
15
-
16
-
17
-
18
-
19
-
20
-
21
-
22
-
23
-
24
-
25
-
26
-
27
-
28
-
29
-
30
-
31
-
32
-
33
-
34
-
35
-
36
-
37
-
38
-
39
-
40
-
41
-
42
-
43
-
44
-
45
-
46
-
47
-
48
-
49
-
50
-
51
-
52
-
53
-
54
-
55
-
56
-
57
-
58
-
59
-
60
-
61
-
62
-
63
-
64
-
65
-
66
-
67
-
68
-
69
-
70
-
71
-
72
-
73
-
74
-
75
-
76
-
77
-
78
-
79
-
80
-
81
-
82
-
83
-
84
-
85
-
86
-
87
-
88
-
89
-
90
-
91
-
92
-
93
-
94
-
95
-
96
-
97
-
98
-
99
-
100
-
101
-
102
-
103
-
104
-
105
-
106
-
107
-
108
-
109
-
110
-
111
-
112
-
113
-
114
-
115
-
116
-
117
-
 118
118 -
 119
119 -
 120
120 -
 121
121 -
 122
122 -
 123
123 -
 124
124 -
 125
125 -
 126
126 -
 127
127 -
 128
128 -
 129
129 -
 130
130 -
 131
131 -
 132
132 -
 133
133 -
 134
134 -
 135
135 -
 136
136 -
 137
137 -
 138
138 -
139
-
140
-
141
-
142
-
143
-
144
-
145
-
146
-
147
-
148
-
149
-
150
-
151
-
152
-
153
-
154
-
155
-
156
-
157
-
158
-
159
-
160
-
161
-
162
-
163
-
164
-
165
-
166
-
167
-
168
-
169
-
170
-
171
-
172
-
173
-
174
-
175
-
176
-
177
-
178
-
179
-
180
-
181
-
182
-
183
-
184
-
185
-
186
-
187
-
188
-
189
-
190
-
191
-
192
-
193
-
194
-
195
-
196
-
197
-
198
-
199
-
200
-
201
-
202
-
203
-
204
-
205
-
206
-
207
-
208
-
209
-
210
-
211
-
212
-
213
-
214
-
215
-
216
 |
 |

F-12
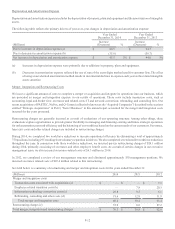
Depreciation and Amortization Expense
Depreciation and amortization expense includes the depreciation of property, plant and equipment and the amortization of intangible
assets.
The following table reflects the primary drivers of year-over-year changes in depreciation and amortization expense:
Year Ended
December 31, 2014
Year Ended
December 31, 2013
(Millions)
Increase
(Decrease) %
Increase
(Decrease) %
Due to increases in depreciation expense (a) $ 80.5 $ 94.7
Due to decreases in amortization expense (b) (35.0) (50.7)
Net increases in depreciation and amortization expense $ 45.5 3% $ 44.0 3%
(a) Increases in depreciation expense were primarily due to additions in property, plant and equipment.
(b) Decreases in amortization expense reflected the use of sum of the years digits method used for customer lists. The effect
of using an accelerated amortization method results in incremental declines in expense each year as the related intangible
assets amortize.
Merger, Integration and Restructuring Costs
We incur a significant amount of costs to complete a merger or acquisition and integrate its operations into our business, which
are presented as merger and integration expense in our results of operations. These costs include transaction costs, such as
accounting, legal and broker fees; severance and related costs; IT and network conversion; rebranding; and consulting fees. Our
recent acquisitions of PAETEC, NuVox, and Q-Comm (collectively known as the “Acquired Companies”) described in the sections
entitled “Strategic Acquisitions” in Part I, “Item I Business” in this annual report accounted for the merger and integration costs
incurred for the years presented.
Restructuring charges are generally incurred as a result of evaluations of our operating structure. Among other things, these
evaluations explore opportunities to provide greater flexibility in managing and financing existing and future strategic operations
for task automation, network efficiency and the balancing of our workforce based on the current needs of our customers. Severance,
lease exit costs and other related charges are included in restructuring charges.
During 2014, we completed two workforce reductions to increase operational efficiency by eliminating a total of approximately
750 positions, including 295 resulting from voluntary separation initiatives. We also completed several smaller workforce reductions
throughout the year. In connection with these workforce reductions, we incurred pre-tax restructuring charges of $24.1 million
during 2014, primarily consisting of severance and other employee benefit costs. As a result of certain changes in our executive
management team, we also incurred severance-related costs of $6.3 million in 2014.
In 2012, we completed a review of our management structure and eliminated approximately 350 management positions. We
incurred severance related costs of $22.4 million related to this restructuring.
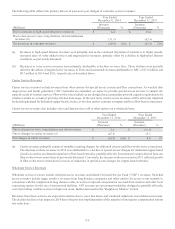
Set forth below is a summary of restructuring and merger and integration costs for the years ended December 31:
(Millions) 2014 2013 2012
Merger and integration costs
Transaction costs associated with acquisitions (a) $—$—$7.1
Employee related transition costs (b) — 7.8 20.3
Information technology conversion costs (c) 20.8 9.5 6.1
Rebranding, consulting and other costs (d) 19.6 12.9 31.9
Total merger and integration costs 40.4 30.2 65.4
Restructuring charges (e) 35.9 8.6 27.2
Total merger, integration and restructuring charges $ 76.3 $ 38.8 $ 92.6