Windstream 2014 Annual Report Download - page 129
Download and view the complete annual report
Please find page 129 of the 2014 Windstream annual report below. You can navigate through the pages in the report by either clicking on the pages listed below, or by using the keyword search tool below to find specific information within the annual report.-
 1
1 -
2
-
3
-
4
-
5
-
6
-
7
-
8
-
9
-
10
-
11
-
12
-
13
-
14
-
15
-
16
-
17
-
18
-
19
-
20
-
21
-
22
-
23
-
24
-
25
-
26
-
27
-
28
-
29
-
30
-
31
-
32
-
33
-
34
-
35
-
36
-
37
-
38
-
39
-
40
-
41
-
42
-
43
-
44
-
45
-
46
-
47
-
48
-
49
-
50
-
51
-
52
-
53
-
54
-
55
-
56
-
57
-
58
-
59
-
60
-
61
-
62
-
63
-
64
-
65
-
66
-
67
-
68
-
69
-
70
-
71
-
72
-
73
-
74
-
75
-
76
-
77
-
78
-
79
-
80
-
81
-
82
-
83
-
84
-
85
-
86
-
87
-
88
-
89
-
90
-
91
-
92
-
93
-
94
-
95
-
96
-
97
-
98
-
99
-
100
-
101
-
102
-
103
-
104
-
105
-
106
-
107
-
108
-
109
-
110
-
111
-
112
-
113
-
114
-
115
-
116
-
117
-
118
-
 119
119 -
 120
120 -
 121
121 -
 122
122 -
 123
123 -
 124
124 -
 125
125 -
 126
126 -
 127
127 -
 128
128 -
 129
129 -
 130
130 -
 131
131 -
 132
132 -
 133
133 -
 134
134 -
 135
135 -
 136
136 -
 137
137 -
 138
138 -
 139
139 -
140
-
141
-
142
-
143
-
144
-
145
-
146
-
147
-
148
-
149
-
150
-
151
-
152
-
153
-
154
-
155
-
156
-
157
-
158
-
159
-
160
-
161
-
162
-
163
-
164
-
165
-
166
-
167
-
168
-
169
-
170
-
171
-
172
-
173
-
174
-
175
-
176
-
177
-
178
-
179
-
180
-
181
-
182
-
183
-
184
-
185
-
186
-
187
-
188
-
189
-
190
-
191
-
192
-
193
-
194
-
195
-
196
-
197
-
198
-
199
-
200
-
201
-
202
-
203
-
204
-
205
-
206
-
207
-
208
-
209
-
210
-
211
-
212
-
213
-
214
-
215
-
216
 |
 |

F-13
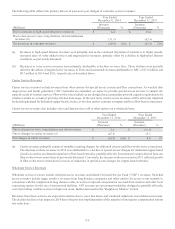
(a) Transaction costs in 2012 primarily relate to accounting, legal and broker fees and other miscellaneous costs associated
with the acquisitions of the Acquired Companies, respectively. These costs are considered indirect or general and are
expensed when incurred.
(b) Employee related transition costs in 2013 and 2012 primarily consist of severance related to the integration of the Acquired
Companies.
(c) Information technology conversion costs primarily consisted of redundant IT platform integrations designed to improve
processes and drive efficiencies.
(d) In 2014, rebranding, consulting and other costs primarily consist of costs incurred related to the proposed spin-off of
certain telecommunications network assets into an independent, publicly traded REIT. See Note 16 to the consolidated
financial statements for additional information related to the proposed transaction. In 2013, we incurred consulting fees
related to network efficiency projects. In 2012, these costs primarily reflected the nationwide rebranding of the PAETEC
markets and consulting fees related to integration activities.
(e) Restructuring charges are primarily due to workforce reductions completed during 2014, as discussed above, as well as
other restructuring activities. In 2013, we incurred charges related to a voluntary workforce reduction initiated to better
align our focus on enterprise customer opportunities. In 2012, these charges primarily related to the management
restructuring initiative discussed above.
Summary of Liability Activity Related to Both Merger and Integration Costs and Restructuring Charges
As of December 31, 2014, we had unpaid merger, integration and restructuring liabilities totaling $11.2 million, which consisted
of $4.3 million associated with the restructuring initiatives and $6.9 million related to merger and integration activities, which are
included in other current liabilities in the accompanying consolidated balance sheet. Payments of these liabilities will be funded
through operating cash flows (See Note 9).
Operating Income
Operating income decreased $501.9 million, or 49.7 percent, in 2014. The decrease was primarily due to reductions in consumer,
carrier and wholesale revenues as a result of continued voice line losses, declining demand for dedicated copper-based circuits,
and the adverse effects of intercarrier compensation reform, respectively. Increased postretirement and pension expense due to an
actuarial loss of $128.6 million and a reduction in the amount of curtailment and settlement gains recognized, higher sales and
marketing expenses attributable to our brand awareness initiatives, restructuring costs related to workforce reductions and additional
depreciation expense resulting from additions to property, plant and equipment also contributed to the declines in operating income
in 2014. Operating income increased $125.1 million, or 14.2 percent in 2013. This increase was primarily due to pension income
of $115.3 million attributable to an actuarial gain recognized in the fourth quarter of 2013 as well as reductions in interconnect
expense of $53.9 million. The favorable effects of these items were partially offset by revenue declines associated with voice line
losses and intercarrier compensation reform as well as increased depreciation expense driven by additions of property, plant and
equipment.
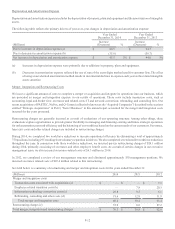
Other Income (Expense), Net
Set forth below is a summary of other income (expense), net for the years ended December 31:
(Millions) 2014 2013 2012
Interest income $ 1.0 $ 1.0 $ 1.0
(Loss) gain on sale of non-strategic assets (a) — (6.4)6.9
Ineffectiveness of interest rate swaps (0.3)1.6(7.5)
Other (expense) income, net (b) (0.6)(8.7)4.2
Other income (expense), net $ 0.1 $ (12.5)$ 4.6
(a) The loss realized in 2013 was primarily due to the disposal of various non-operating real estate assets. The gain recognized
in 2012 was primarily related to the sale of wireless assets associated with Iowa Telecom and D&E Communications,
Inc. (“D&E”).