Windstream 2014 Annual Report Download - page 143
Download and view the complete annual report
Please find page 143 of the 2014 Windstream annual report below. You can navigate through the pages in the report by either clicking on the pages listed below, or by using the keyword search tool below to find specific information within the annual report.-
 1
1 -
2
-
3
-
4
-
5
-
6
-
7
-
8
-
9
-
10
-
11
-
12
-
13
-
14
-
15
-
16
-
17
-
18
-
19
-
20
-
21
-
22
-
23
-
24
-
25
-
26
-
27
-
28
-
29
-
30
-
31
-
32
-
33
-
34
-
35
-
36
-
37
-
38
-
39
-
40
-
41
-
42
-
43
-
44
-
45
-
46
-
47
-
48
-
49
-
50
-
51
-
52
-
53
-
54
-
55
-
56
-
57
-
58
-
59
-
60
-
61
-
62
-
63
-
64
-
65
-
66
-
67
-
68
-
69
-
70
-
71
-
72
-
73
-
74
-
75
-
76
-
77
-
78
-
79
-
80
-
81
-
82
-
83
-
84
-
85
-
86
-
87
-
88
-
89
-
90
-
91
-
92
-
93
-
94
-
95
-
96
-
97
-
98
-
99
-
100
-
101
-
102
-
103
-
104
-
105
-
106
-
107
-
108
-
109
-
110
-
111
-
112
-
113
-
114
-
115
-
116
-
117
-
118
-
119
-
120
-
121
-
122
-
123
-
124
-
125
-
126
-
127
-
128
-
129
-
130
-
131
-
132
-
 133
133 -
 134
134 -
 135
135 -
 136
136 -
 137
137 -
 138
138 -
 139
139 -
 140
140 -
 141
141 -
 142
142 -
 143
143 -
 144
144 -
 145
145 -
 146
146 -
 147
147 -
 148
148 -
 149
149 -
 150
150 -
 151
151 -
 152
152 -
 153
153 -
154
-
155
-
156
-
157
-
158
-
159
-
160
-
161
-
162
-
163
-
164
-
165
-
166
-
167
-
168
-
169
-
170
-
171
-
172
-
173
-
174
-
175
-
176
-
177
-
178
-
179
-
180
-
181
-
182
-
183
-
184
-
185
-
186
-
187
-
188
-
189
-
190
-
191
-
192
-
193
-
194
-
195
-
196
-
197
-
198
-
199
-
200
-
201
-
202
-
203
-
204
-
205
-
206
-
207
-
208
-
209
-
210
-
211
-
212
-
213
-
214
-
215
-
216
 |
 |

F-27
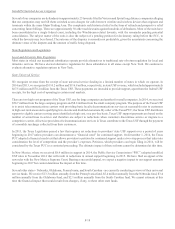
At December 31, 2014, our unamortized finite-lived intangible assets totaled $1,764.0 million and primarily consisted of franchise
rights of $1,041.8 million and customer lists of $710.6 million. The customer lists are amortized using the sum-of-the-years digits
method over estimated useful lives ranging from 9 to 15 years. The franchise rights are amortized on a straight-line basis over
their estimated useful lives of 30 years. A reduction in the average useful lives of the franchise rights and customer lists of one
year would have increased the amount of amortization expense recorded in 2014 by approximately $9.9 million.
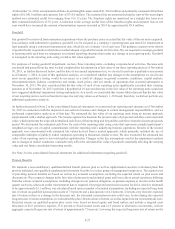
Goodwill
Our goodwill was derived from numerous acquisitions where the purchase price exceeded the fair value of the net assets acquired.
In accordance with authoritative guidance, goodwill is to be assigned to a company’s reporting units and tested for impairment at
least annually using a consistent measurement date, which for us is January 1st of each year. This guidance requires write-downs
of goodwill only in periods in which the recorded amount of goodwill exceeds its fair value. We are required to reassign goodwill
to reporting units each time we reorganize our internal reporting structure that results in a change in our reporting units. Goodwill
is reassigned to the reporting units using a relative fair value approach.
For purposes of testing goodwill impairment, we have three reporting units, excluding corporate-level activities. Because only
one month had passed from the time we had completed the determination of fair value of our three reporting units as of November
30, 2013, as further discussed below, and the date of our annual impairment test, we elected to perform a qualitative assessment
as of January 1, 2014. As part of this qualitative analysis, we considered whether any changes to the assumptions we used in our
most recent quantitative testing would be necessary as a result of changes in general economic conditions, capital markets,
telecommunications industry competition and trends, stock prices, and our results of operations that occurred subsequent to
November 30, 2013. We also considered that the fair value of each of our reporting units significantly exceeded their carrying
amounts as of November 30, 2013 such that a hypothetical 10 percent decrease in the fair value of the reporting units would not
have triggered additional impairment testing and analysis. As a result, we concluded that is more likely than not that the fair value
of our reporting units is not less than their respective carrying values as of January 1, 2014 and, therefore, we did not perform any
additional quantitative analysis.
As further discussed in Note 2 to the consolidated financial statements, we reassessed our reporting unit structure as of November
30, 2013 in connection with the disposal of our software business and changes in certain management responsibilities, and we
performed a quantitative analysis as of that date. We estimated the fair value of our reporting units using an income approach
supplemented with a market approach. The income approach is based on the present value of projected cash flows and a terminal
value, which represents the expected normalized cash flows of the reporting unit beyond the cash flows from the discrete projection
period. We discounted the estimated cash flows for each of the reporting units using a rate that represents a market participant’s
weighted average cost of capital commensurate with the reporting unit’s underlying business operations. Results of the income
approach were corroborated with estimated fair values derived from a market approach, which primarily included the use of
comparable multiples of publicly traded companies operating in businesses similar to ours. We also reconciled the estimated fair
value of our reporting units to our total market capitalization. Changes in the key assumptions used in the impairment analysis
due to changes in market conditions could adversely affect the calculated fair value of goodwill, materially affecting the carrying
value and our future consolidated operating results.
See Note 2 to the consolidated financial statements for additional information regarding goodwill.
Pension Benefits
We maintain a non-contributory qualified defined benefit pension plan as well as supplemental executive retirement plans that
provide unfunded, non-qualified supplemental retirement benefits to a select group of management employees. The annual costs
of providing pension benefits are based on certain key actuarial assumptions, including the expected return on plan assets and
discount rate. We recognize changes in the fair value of plan assets and actuarial gains and losses due to actual experience differing
from the various actuarial assumptions, including changes in our pension obligation, as pension expense or income in the fourth
quarter each year, unless an earlier measurement date is required. Our projected net pension income for 2014, which is estimated
to be approximately $1.1 million, was calculated based upon a number of actuarial assumptions, including an expected long-term
rate of return on qualified pension plan assets of 7.0 percent and a discount rate of 4.14 percent. If returns vary from the expected
rate of return or there is a change in the discount rate, the estimated net pension income could vary. In developing the expected
long-term rate of return assumption, we considered the plan’s historical rate of return, as well as input from our investment advisors.
Projected returns on qualified pension plan assets were based on broad equity and bond indices and include a targeted asset
allocation of 26.0 percent to equities, 53.0 percent to fixed income assets and 21.0 percent to alternative investments, with an
aggregate expected long-term rate of return of approximately 7.0 percent. Lowering the expected long-term rate of return on the