Windstream 2014 Annual Report Download - page 169
Download and view the complete annual report
Please find page 169 of the 2014 Windstream annual report below. You can navigate through the pages in the report by either clicking on the pages listed below, or by using the keyword search tool below to find specific information within the annual report.-
 1
1 -
2
-
3
-
4
-
5
-
6
-
7
-
8
-
9
-
10
-
11
-
12
-
13
-
14
-
15
-
16
-
17
-
18
-
19
-
20
-
21
-
22
-
23
-
24
-
25
-
26
-
27
-
28
-
29
-
30
-
31
-
32
-
33
-
34
-
35
-
36
-
37
-
38
-
39
-
40
-
41
-
42
-
43
-
44
-
45
-
46
-
47
-
48
-
49
-
50
-
51
-
52
-
53
-
54
-
55
-
56
-
57
-
58
-
59
-
60
-
61
-
62
-
63
-
64
-
65
-
66
-
67
-
68
-
69
-
70
-
71
-
72
-
73
-
74
-
75
-
76
-
77
-
78
-
79
-
80
-
81
-
82
-
83
-
84
-
85
-
86
-
87
-
88
-
89
-
90
-
91
-
92
-
93
-
94
-
95
-
96
-
97
-
98
-
99
-
100
-
101
-
102
-
103
-
104
-
105
-
106
-
107
-
108
-
109
-
110
-
111
-
112
-
113
-
114
-
115
-
116
-
117
-
118
-
119
-
120
-
121
-
122
-
123
-
124
-
125
-
126
-
127
-
128
-
129
-
130
-
131
-
132
-
133
-
134
-
135
-
136
-
137
-
138
-
139
-
140
-
141
-
142
-
143
-
144
-
145
-
146
-
147
-
148
-
149
-
150
-
151
-
152
-
153
-
154
-
155
-
156
-
157
-
158
-
 159
159 -
 160
160 -
 161
161 -
 162
162 -
 163
163 -
 164
164 -
 165
165 -
 166
166 -
 167
167 -
 168
168 -
 169
169 -
 170
170 -
 171
171 -
 172
172 -
 173
173 -
 174
174 -
 175
175 -
 176
176 -
 177
177 -
 178
178 -
 179
179 -
180
-
181
-
182
-
183
-
184
-
185
-
186
-
187
-
188
-
189
-
190
-
191
-
192
-
193
-
194
-
195
-
196
-
197
-
198
-
199
-
200
-
201
-
202
-
203
-
204
-
205
-
206
-
207
-
208
-
209
-
210
-
211
-
212
-
213
-
214
-
215
-
216
 |
 |

NOTES TO CONSOLIDATED FINANCIAL STATEMENTS
____
F-53
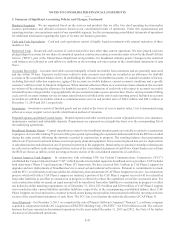
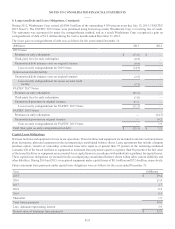
3. Goodwill and Other Intangible Assets:
Goodwill represents the excess of cost over the fair value of net identifiable tangible and intangible assets acquired through various
business combinations. The cost of acquired entities at the date of the acquisition is allocated to identifiable assets, and the excess
of the total purchase price over the amounts assigned to identifiable assets has been recorded as goodwill.
Changes in the carrying amount of goodwill were as follows:
(Millions)
Balance at December 31, 2013 $ 4,331.4
Acquisition during the period (a) 21.4
Balance at December 31, 2014 $ 4,352.8
(a) On October 1, 2014, we acquired for cash a fixed wireless enterprise services provider with operations in four states.
As of January 1, 2014, we determined we had three reporting units, excluding corporate-level activities. After considering changes
to assumptions used in our most recent quantitative testing completed as of November 30, 2013, including general economic
conditions, capital markets, telecommunications industry competition and trends, changes in common stock prices, our results of
operations, and the magnitude of the excess of the fair value over the carrying value of each of our reporting units as determined
in our most recent quantitative testing, we concluded that it is more likely than not that the fair value of our reporting units is not
less than their respective carrying values and, therefore, we did not perform a quantitative analysis.
Intangible assets were as follows at December 31:
2014 2013
(Millions)
Gross
Cost
Accumulated
Amortization
Net Carrying
Value
Gross
Cost
Accumulated
Amortization
Net Carrying
Value
Franchise rights $ 1,285.1 $ (243.3) $ 1,041.8 $ 1,285.1 $ (200.4) $ 1,084.7
Customer lists 1,914.0 (1,203.4) 710.6 1,914.0 (991.9) 922.1
Cable franchise rights 39.8 (28.2) 11.6 39.8 (27.0) 12.8
Other 37.9 (37.9) — 37.9 (37.4)0.5
Balance $ 3,276.8 $ (1,512.8) $ 1,764.0 $ 3,276.8 $ (1,256.7) $ 2,020.1
Intangible asset amortization methodology and useful lives were as follows as of December 31, 2014:
Intangible Assets Amortization Methodology Estimated Useful Life
Franchise rights straight-line 30 years
Customer lists sum of years digits 9 - 15 years
Cable franchise rights straight-line 15 years
Other straight-line 1 - 3 years
Amortization expense for intangible assets subject to amortization was $256.1 million, $291.2 million and $342.0 million in 2014,
2013 and 2012, respectively. Amortization expense for intangible assets subject to amortization was estimated to be as follows
for each of the years ended December 31:
Year (Millions)
2015 $ 223.1
2016 192.7
2017 164.8
2018 137.9
2019 111.2
Thereafter 934.3
Total $ 1,764.0