Windstream 2014 Annual Report Download - page 195
Download and view the complete annual report
Please find page 195 of the 2014 Windstream annual report below. You can navigate through the pages in the report by either clicking on the pages listed below, or by using the keyword search tool below to find specific information within the annual report.-
 1
1 -
2
-
3
-
4
-
5
-
6
-
7
-
8
-
9
-
10
-
11
-
12
-
13
-
14
-
15
-
16
-
17
-
18
-
19
-
20
-
21
-
22
-
23
-
24
-
25
-
26
-
27
-
28
-
29
-
30
-
31
-
32
-
33
-
34
-
35
-
36
-
37
-
38
-
39
-
40
-
41
-
42
-
43
-
44
-
45
-
46
-
47
-
48
-
49
-
50
-
51
-
52
-
53
-
54
-
55
-
56
-
57
-
58
-
59
-
60
-
61
-
62
-
63
-
64
-
65
-
66
-
67
-
68
-
69
-
70
-
71
-
72
-
73
-
74
-
75
-
76
-
77
-
78
-
79
-
80
-
81
-
82
-
83
-
84
-
85
-
86
-
87
-
88
-
89
-
90
-
91
-
92
-
93
-
94
-
95
-
96
-
97
-
98
-
99
-
100
-
101
-
102
-
103
-
104
-
105
-
106
-
107
-
108
-
109
-
110
-
111
-
112
-
113
-
114
-
115
-
116
-
117
-
118
-
119
-
120
-
121
-
122
-
123
-
124
-
125
-
126
-
127
-
128
-
129
-
130
-
131
-
132
-
133
-
134
-
135
-
136
-
137
-
138
-
139
-
140
-
141
-
142
-
143
-
144
-
145
-
146
-
147
-
148
-
149
-
150
-
151
-
152
-
153
-
154
-
155
-
156
-
157
-
158
-
159
-
160
-
161
-
162
-
163
-
164
-
165
-
166
-
167
-
168
-
169
-
170
-
171
-
172
-
173
-
174
-
175
-
176
-
177
-
178
-
179
-
180
-
181
-
182
-
183
-
184
-
 185
185 -
 186
186 -
 187
187 -
 188
188 -
 189
189 -
 190
190 -
 191
191 -
 192
192 -
 193
193 -
 194
194 -
 195
195 -
 196
196 -
 197
197 -
 198
198 -
 199
199 -
 200
200 -
 201
201 -
 202
202 -
 203
203 -
 204
204 -
 205
205 -
206
-
207
-
208
-
209
-
210
-
211
-
212
-
213
-
214
-
215
-
216
 |
 |

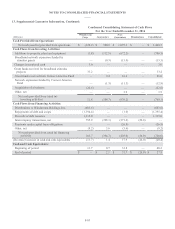
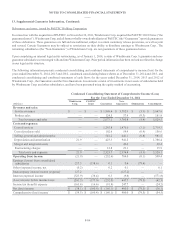
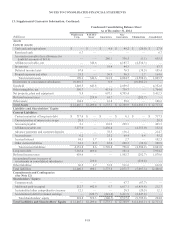
NOTES TO CONSOLIDATED FINANCIAL STATEMENTS
____
F-79
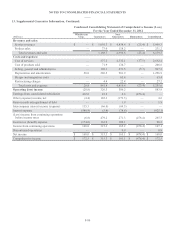
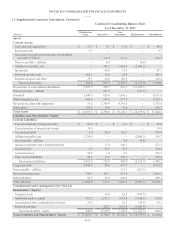
13. Supplemental Guarantor Information, Continued:
Condensed Consolidating Statement of Comprehensive Income (Loss)
For the Year Ended December 31, 2013
(Millions)
Windstream
Corp. Guarantors
Non-
Guarantors Eliminations Consolidated
Revenues and sales:
Service revenues $ — $ 1,065.6 $ 4,740.3 $ (30.4) $ 5,775.5
Product sales — 54.4 158.2 — 212.6
Total revenues and sales — 1,120.0 4,898.5 (30.4) 5,988.1
Costs and expenses:
Cost of services — 339.6 2,178.1 (25.6) 2,492.1
Cost of products sold — 53.7 130.2 — 183.9
Selling, general and administrative — 77.8 849.9 (4.8) 922.9
Depreciation and amortization 25.0 292.2 1,023.7 — 1,340.9
Merger and integration costs — — 30.2 — 30.2
Restructuring charges — 1.6 7.0 — 8.6
Total costs and expenses 25.0 764.9 4,219.1 (30.4) 4,978.6
Operating (loss) income (25.0) 355.1 679.4 — 1,009.5
Earnings from consolidated subsidiaries 526.1 53.3 5.6 (585.0)—
Other income (expense), net 2.1 166.1 (180.7)—
(12.5)
Loss on early extinguishment of debt (17.2)—
(11.3)—
(28.5)
Intercompany interest income (expense) 134.5 (61.1)(73.4)— —
Interest expense (584.6)(5.8)(37.3)—
(627.7)
Income from continuing operations before
income taxes 35.9 507.6 382.3 (585.0) 340.8
Income tax (benefit) expense (205.4) 169.3 141.6 — 105.5
Income from continuing operations 241.3 338.3 240.7 (585.0) 235.3
Discontinued operations — — 6.0 — 6.0
Net income $ 241.3 $ 338.3 $ 246.7 $ (585.0) $ 241.3
Comprehensive income $ 263.4 $ 338.3 $ 246.7 $ (585.0) $ 263.4