Windstream 2014 Annual Report Download - page 124
Download and view the complete annual report
Please find page 124 of the 2014 Windstream annual report below. You can navigate through the pages in the report by either clicking on the pages listed below, or by using the keyword search tool below to find specific information within the annual report.-
 1
1 -
2
-
3
-
4
-
5
-
6
-
7
-
8
-
9
-
10
-
11
-
12
-
13
-
14
-
15
-
16
-
17
-
18
-
19
-
20
-
21
-
22
-
23
-
24
-
25
-
26
-
27
-
28
-
29
-
30
-
31
-
32
-
33
-
34
-
35
-
36
-
37
-
38
-
39
-
40
-
41
-
42
-
43
-
44
-
45
-
46
-
47
-
48
-
49
-
50
-
51
-
52
-
53
-
54
-
55
-
56
-
57
-
58
-
59
-
60
-
61
-
62
-
63
-
64
-
65
-
66
-
67
-
68
-
69
-
70
-
71
-
72
-
73
-
74
-
75
-
76
-
77
-
78
-
79
-
80
-
81
-
82
-
83
-
84
-
85
-
86
-
87
-
88
-
89
-
90
-
91
-
92
-
93
-
94
-
95
-
96
-
97
-
98
-
99
-
100
-
101
-
102
-
103
-
104
-
105
-
106
-
107
-
108
-
109
-
110
-
111
-
112
-
113
-
 114
114 -
 115
115 -
 116
116 -
 117
117 -
 118
118 -
 119
119 -
 120
120 -
 121
121 -
 122
122 -
 123
123 -
 124
124 -
 125
125 -
 126
126 -
 127
127 -
 128
128 -
 129
129 -
 130
130 -
 131
131 -
 132
132 -
 133
133 -
 134
134 -
135
-
136
-
137
-
138
-
139
-
140
-
141
-
142
-
143
-
144
-
145
-
146
-
147
-
148
-
149
-
150
-
151
-
152
-
153
-
154
-
155
-
156
-
157
-
158
-
159
-
160
-
161
-
162
-
163
-
164
-
165
-
166
-
167
-
168
-
169
-
170
-
171
-
172
-
173
-
174
-
175
-
176
-
177
-
178
-
179
-
180
-
181
-
182
-
183
-
184
-
185
-
186
-
187
-
188
-
189
-
190
-
191
-
192
-
193
-
194
-
195
-
196
-
197
-
198
-
199
-
200
-
201
-
202
-
203
-
204
-
205
-
206
-
207
-
208
-
209
-
210
-
211
-
212
-
213
-
214
-
215
-
216
 |
 |

F-8
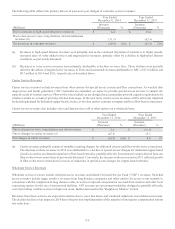
The following table reflects the primary drivers of year-over-year changes in consumer service revenues:
Year Ended
December 31, 2014
Year Ended
December 31, 2013
(Millions)
Increase
(Decrease) %
Increase
(Decrease) %
Due to increases in high-speed Internet revenues (a) $ 6.4 $ 19.6
Due to decreases in voice, long distance, and miscellaneous
revenues (b) (31.3) (62.9)
Net decreases in consumer revenues $(24.9)(2)%$ (43.3)(3)%
(a) Increases in high-speed Internet revenues were primarily due to the continued migration of customers to higher speeds,
increased sales of value added services and targeted price increases, partially offset by a decline in high-speed Internet
customers, as previously discussed.
(b) Decreases in voice service revenues were primarily attributable to declines in voice lines. These declines were partially
offset by the affects of targeted price increases in 2014 and incremental revenues attributable to ARC of $7.8 million and
$9.7 million in 2014 and 2013, respectively, as described above.
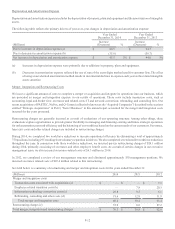
Carrier Service Revenues
Carrier service revenues include revenues from other carriers for special access circuits and fiber connections. As wireless data
usage grows and fourth generation (“4G”) networks are expanded, we expect to provide special access services to support the
capacity needs of wireless carriers. Fiber-to-the-tower initiatives are designed to accommodate network capacity requirements for
wireless carriers as a result of growing wireless data usage. In the near term, carrier access revenues will be adversely impacted
by declining demand for dedicated copper-based circuits, as wireless carriers continue to migrate traffic to fiber-based connections.
Carrier service revenues also includes voice and data services sold to other carriers on a wholesale basis.
Year Ended
December 31, 2014
Year Ended
December 31, 2013
(Millions)
Increase
(Decrease) %
Increase
(Decrease) %
Due to changes in voice, long distance and other revenues $ 2.6 $ (11.3)
Due to changes in carrier revenues (a) (47.5) 15.3
Net changes in carrier revenues $(44.9)(6)%$ 4.0 1%
(a) Carrier revenues primarily consist of monthly recurring charges for dedicated circuits and fiber-to-the-tower connections.
The decrease in these revenues in 2014 was attributable to a decline in special access charges for dedicated copper-based
circuits as carriers accelerated migration to fiber-based networks, partially offset by incremental revenues derived from our
fiber-to-the-tower connections, as previously discussed. Conversely, the increase in these revenues in 2013 reflected growth
in fiber-to-the tower connections in excess of reductions in special access charges for copper-based networks.
Wholesale Service Revenues
Wholesale service revenues include switched access revenues and federal Universal Service Fund (“USF”) revenues. Switched
access revenues include usage sensitive revenues from long distance companies and other carriers for access to our network in
connection with the completion of long distance calls, as well as reciprocal compensation received from wireless and other local
connecting carriers for the use of our network facilities. USF revenues are government subsidies designed to partially offset the
cost of providing wireline services in high-cost areas, further discussed in the “Regulatory Matters” section.
Revenues from these services are expected to decline due to voice line losses and continued reductions in switched access rates.
The declines had less of an impact in 2014 due to the previous implementation of the majority of intercarrier compensation reform
rate reductions.