APC 1999 Annual Report Download - page 26
Download and view the complete annual report
Please find page 26 of the 1999 APC annual report below. You can navigate through the pages in the report by either clicking on the pages listed below, or by using the keyword search tool below to find specific information within the annual report.-
 1
1 -
2
-
3
-
4
-
5
-
6
-
7
-
8
-
9
-
10
-
11
-
12
-
13
-
14
-
15
-
 16
16 -
 17
17 -
 18
18 -
 19
19 -
 20
20 -
 21
21 -
 22
22 -
 23
23 -
 24
24 -
 25
25 -
 26
26 -
 27
27 -
 28
28 -
 29
29 -
 30
30 -
 31
31 -
 32
32 -
 33
33 -
 34
34 -
 35
35 -
 36
36 -
37
-
38
-
39
-
40
-
41
-
42
-
43
-
44
-
45
-
46
-
47
-
48
-
49
-
50
 |
 |

24
Financial highlights
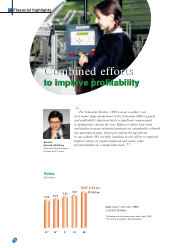
0.55 0.59
0.76
0.85 FF 6.9 bn
EUR 1.06 bn
95* 96* 97 98 99
98 99 98 99 98 99 98 99
8.5 8.7
10.5
11.2
12.6
●
Operating margin
* Pro forma restated for Spie Batignolles
Operating margin by geographic division
(%)
11.6 12.8 13.7 14.9
13.2 13.8
6.0
7.7
Europe France North International
(excl. France) America
Operating margin by business
(%)
11.8
98 99
13.1
Operating income
(EUR billion)
Electrical
distribution
10.0
11.5
98 99
Industrial control
and automation
The operating margin widened to 12.6% in
1999 thanks to the results of the Schneider
2000+ action plans and the impact of Lexel.
Margin improved significantly from the previous
year in all the geographic areas and businesses.