American Express 2008 Annual Report Download - page 105
Download and view the complete annual report
Please find page 105 of the 2008 American Express annual report below. You can navigate through the pages in the report by either clicking on the pages listed below, or by using the keyword search tool below to find specific information within the annual report.-
 1
1 -
2
-
3
-
4
-
5
-
6
-
7
-
8
-
9
-
10
-
11
-
12
-
13
-
14
-
15
-
16
-
17
-
18
-
19
-
20
-
21
-
22
-
23
-
24
-
25
-
26
-
27
-
28
-
29
-
30
-
31
-
32
-
33
-
34
-
35
-
36
-
37
-
38
-
39
-
40
-
41
-
42
-
43
-
44
-
45
-
46
-
47
-
48
-
49
-
50
-
51
-
52
-
53
-
54
-
55
-
56
-
57
-
58
-
59
-
60
-
61
-
62
-
63
-
64
-
65
-
66
-
67
-
68
-
69
-
70
-
71
-
72
-
73
-
74
-
75
-
76
-
77
-
78
-
79
-
80
-
81
-
82
-
83
-
84
-
85
-
86
-
87
-
88
-
89
-
90
-
91
-
92
-
93
-
94
-
 95
95 -
 96
96 -
 97
97 -
 98
98 -
 99
99 -
 100
100 -
 101
101 -
 102
102 -
 103
103 -
 104
104 -
 105
105 -
 106
106 -
 107
107 -
 108
108 -
 109
109 -
 110
110 -
 111
111 -
 112
112 -
 113
113 -
 114
114 -
 115
115 -
116
-
117
-
118
-
119
-
120
-
121
-
122
-
123
-
124
-
125
 |
 |

notes to consolidated financial statements
american express company
103
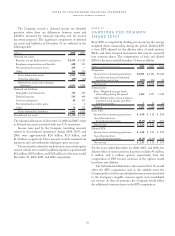
stock options
Each stock option has an exercise price equal to the market
price of the Company’s common stock on the date of grant and
a contractual term of 10 years from the date of grant. Stock
options vest ratably, substantially all at 25 percent per year
beginning with the first anniversary of the grant date.
The weighted-average remaining contractual life of the stock
options outstanding and exercisable as of December 31, 2008
was 4.0 years and 2.9 years, respectively. At December 31, 2008,
the stock options outstanding and exercisable had no intrinsic
value (the amount by which the fair value of the Company’s
stock exceeds the exercise price of the option).
The intrinsic value for options exercised during 2008, 2007,
and 2006 was $79 million, $463 million, and $661 million,
respectively (based upon the fair value of the Company’s stock
price at the date of exercise).
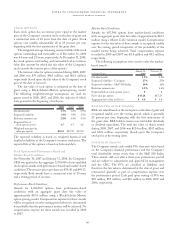
The fair value of each option is estimated on the date of
grant using a Black-Scholes-Merton option-pricing model.
The following weighted-average assumptions are used for
grants issued in 2008, 2007, and 2006, the majority of which
were granted in the beginning of each year:
2008 2007 2006
Dividend yield 1.5% 1.0% 0.9%
Expected volatility 19% 19% 23%
Risk-free interest rate 2.8% 4.8% 4.3%
Expected life of
stock option (years) 4.7 4.7 4.6
Weighted-average fair
value per option $8.24 $13.39 $12.76
The expected volatility is based on weighted historical and
implied volatilities of the Company’s common stock price. The
expected life of the options is based on historical data.
Stock Options with Performance-Based and
Market-Based Conditions
On November 30, 2007 and January 31, 2008, the Company’s
CEO was granted in the aggregate 2,750,000 of non-qualified
stock option awards with performance-based and market-based
conditions. The exercise prices per share are $58.98 and $49.13,
respectively. Both awards have a contractual term of 10 years
and a vesting period of six years.
Performance-Based Conditions
Awards for 2,062,500 options have performance-based
conditions with an aggregate grant date fair value of
approximately $33.8 million using a Black-Scholes-Merton
option-pricing model. Compensation expense for these awards
will be recognized over the vesting period when it is determined
it is probable that the performance metrics will be achieved. No
compensation expense for these awards was recorded in 2008
or 2007.
Market-Based Conditions
Awards for 687,500 options have market-based conditions
with an aggregate grant date fair value of approximately $10.5
million using a Monte Carlo valuation model. Compensation
expense for the fair value of these awards is recognized ratably
over the vesting period irrespective of the probability of the
market metric being achieved. Total compensation expense
recorded in 2008 and 2007 was $2.4 million and $0.1 million,
respectively.
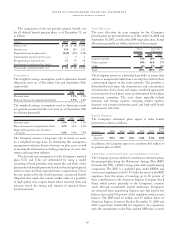
The following assumptions were used to value the market-
based awards:
At Date of Grant
January 31,
2008
November 30,
2007
Dividend yield 1.5% 1.2%
Expected volatility – Company 27% 27%
Expected volatility – S&P 500 Index 16% 16%
Risk-free interest rate 4.5% 4.6%
Expected life of stock option (years) 88
Fair value per option $13.28 $17.25
Aggregate fair value (millions) $ 4.6 $ 5.9
restricted stock awards
RSAs are valued based on the stock price on the date of grant and
recognized ratably over the vesting period, which is generally
25 percent per year, beginning with the first anniversary of
the grant date. RSA holders receive non-forfeitable dividends
or dividend equivalents. The total fair value of shares vested
during 2008, 2007, and 2006 was $134 million, $203 million,
and $176 million, respectively (based upon the Company’s
stock price at the vesting date).
portfolio grants
The Company awards cash-settled PGs that earn value based
on the Company’s financial performance and the Company’s
total shareholder return versus that of the S&P 500 Index.
These awards cliff vest after a three-year performance period
and are subject to adjustments and approval by management
and the CBC. The PGs are classified as liabilities and,
therefore, the fair value is determined at the date of grant and
remeasured quarterly as part of compensation expense over
the performance period. Cash paid upon vesting of PGs was
$59 million, $55 million, and $56 million in 2008, 2007 and
2006, respectively.