American Express 2008 Annual Report Download - page 110
Download and view the complete annual report
Please find page 110 of the 2008 American Express annual report below. You can navigate through the pages in the report by either clicking on the pages listed below, or by using the keyword search tool below to find specific information within the annual report.-
 1
1 -
2
-
3
-
4
-
5
-
6
-
7
-
8
-
9
-
10
-
11
-
12
-
13
-
14
-
15
-
16
-
17
-
18
-
19
-
20
-
21
-
22
-
23
-
24
-
25
-
26
-
27
-
28
-
29
-
30
-
31
-
32
-
33
-
34
-
35
-
36
-
37
-
38
-
39
-
40
-
41
-
42
-
43
-
44
-
45
-
46
-
47
-
48
-
49
-
50
-
51
-
52
-
53
-
54
-
55
-
56
-
57
-
58
-
59
-
60
-
61
-
62
-
63
-
64
-
65
-
66
-
67
-
68
-
69
-
70
-
71
-
72
-
73
-
74
-
75
-
76
-
77
-
78
-
79
-
80
-
81
-
82
-
83
-
84
-
85
-
86
-
87
-
88
-
89
-
90
-
91
-
92
-
93
-
94
-
95
-
96
-
97
-
98
-
99
-
 100
100 -
 101
101 -
 102
102 -
 103
103 -
 104
104 -
 105
105 -
 106
106 -
 107
107 -
 108
108 -
 109
109 -
 110
110 -
 111
111 -
 112
112 -
 113
113 -
 114
114 -
 115
115 -
 116
116 -
 117
117 -
 118
118 -
 119
119 -
 120
120 -
121
-
122
-
123
-
124
-
125
 |
 |

notes to consolidated financial statements
american express company
108
in 2007, the Company amended the RSP effective July 1, 2007.
These amendments include an expanded definition of pay
encompassing more elements of employee compensation (total
pay) as well as an increase in the Company’s matching of
employees’ contributions to the plan from a maximum of
3 percent of base pay to a maximum of 5 percent of total pay.
Additional annual conversion contributions of up to 8 percent of
total pay will be provided into the RSP in the future for eligible
employees who were hired before April 1, 2007. The Company
also sponsors an unfunded non-qualified Supplemental
Retirement Plan (the SRP-RSP) that was also amended during
2007, and its terms generally parallel those of the RSP.
The total expense for all defined contribution plans globally
was $211 million, $173 million, and $106 million in 2008,
2007, and 2006, respectively.
other postretirement benefits plans
The Company sponsors unfunded defined postretirement
benefit plans that provide health care and life insurance to
certain retired U.S. employees.
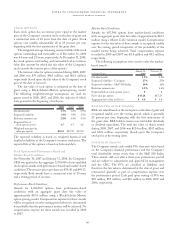
Accumulated Other Comprehensive Loss
The following table provides the amounts comprising
accumulated other comprehensive loss which are not yet
recognized as components of net periodic benefit cost as of
December 31:
(Millions) 2008 2007
Net actuarial loss $ 47 $ 66
Net prior service cost (2) (4)
Total, pretax effect 45 62
Tax impact (18) (25)
Total, net of taxes $ 27 $ 37
The estimated portion of the net actuarial loss and net prior
service credit above that is expected to be recognized as a
component of net periodic benefit cost in 2009 is $2 million
and $(2) million, respectively.
The following table details the amounts recognized in other
comprehensive loss in 2008:
(Millions) 2008
Net actuarial gain:
Reclassified to earnings from equity $ (4)
Gains in current year (14)
Net actuarial gain (18)
Net prior service cost:
Reclassified to earnings from equity 2
Net prior service cost 2
Total, pretax $(16)
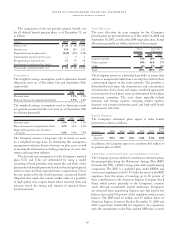
Plan Obligations
The following table provides a reconciliation of the changes in
the projected benefit obligation for all plans accounted for under
SFAS No. 106, “Employers’ Accounting for Postretirement
Benefits Other Than Pensions” (SFAS No. 106) (2008 changes
and end of year amounts are as of December 31, 2008 and all
2007 amounts and 2008 beginning of year amounts are as of
September 30, 2007):
Reconciliation of Change in Projected Benefit Obligation
(Millions) 2008 2007
Projected benefit obligation $312 $376
Effect of transition to December 31st
measurement date 1—
Service cost 66
Interest cost 19 19
Benefits paid (27) (23)
Actuarial gain (16) (66)
Net change (17) (64)
Projected benefit obligation, end of year $295 $312
The liabilities for the Company’s defined postretirement
benefit plans recognized on the Consolidated Balance Sheets
as of December 31 are included in the table below:
Reconciliation of Accrued Benefit Cost and Total Amount
Recognized
(Millions) 2008 2007
Funded status of the plan $(295) $(312)
Fourth quarter payments —5
Net amount recognized at December 31, $(295) $(307)
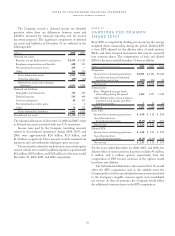
Net Periodic Benefit Cost
SFAS No. 106 provides for the delayed recognition of the
net actuarial loss and the net prior service credit remaining in
accumulated other comprehensive income (loss).
The following table provides the components of
the net periodic benefit cost as of December 31 for all
defined postretirement benefit plans accounted for under
SFAS No. 106:
(Millions) 2008 2007 2006
Service cost $ 6 $ 6 $ 7
Interest cost 19 19 20
Amortization of prior service costs (2) (2) (2)
Recognized net actuarial loss 48 14
Net periodic benefit cost $27 $31 $39