American Express 2008 Annual Report Download - page 28
Download and view the complete annual report
Please find page 28 of the 2008 American Express annual report below. You can navigate through the pages in the report by either clicking on the pages listed below, or by using the keyword search tool below to find specific information within the annual report.-
 1
1 -
2
-
3
-
4
-
5
-
6
-
7
-
8
-
9
-
10
-
11
-
12
-
13
-
14
-
15
-
16
-
17
-
 18
18 -
 19
19 -
 20
20 -
 21
21 -
 22
22 -
 23
23 -
 24
24 -
 25
25 -
 26
26 -
 27
27 -
 28
28 -
 29
29 -
 30
30 -
 31
31 -
 32
32 -
 33
33 -
 34
34 -
 35
35 -
 36
36 -
 37
37 -
 38
38 -
39
-
40
-
41
-
42
-
43
-
44
-
45
-
46
-
47
-
48
-
49
-
50
-
51
-
52
-
53
-
54
-
55
-
56
-
57
-
58
-
59
-
60
-
61
-
62
-
63
-
64
-
65
-
66
-
67
-
68
-
69
-
70
-
71
-
72
-
73
-
74
-
75
-
76
-
77
-
78
-
79
-
80
-
81
-
82
-
83
-
84
-
85
-
86
-
87
-
88
-
89
-
90
-
91
-
92
-
93
-
94
-
95
-
96
-
97
-
98
-
99
-
100
-
101
-
102
-
103
-
104
-
105
-
106
-
107
-
108
-
109
-
110
-
111
-
112
-
113
-
114
-
115
-
116
-
117
-
118
-
119
-
120
-
121
-
122
-
123
-
124
-
125
 |
 |

2008 financial review
american express company
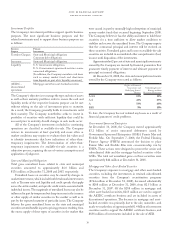
The table below summarizes selected statistics for billed business and average spend:
2008 2007
Percentage
Increase
(Decrease)
Percentage
Increase
(Decrease)
Assuming
No Changes
in Foreign
Exchange
Rates
Percentage
Increase
Percentage
Increase
Assuming
No Changes
in Foreign
Exchange
Rates
Worldwide(a)
Billed business 6% 5% 15% 13%
Proprietary billed business 4 3 13 11
GNS volumes(b) 27 27 49 43
Average spending per proprietary basic card (1) (1) 8 6
Basic cards-in-force 812
United States(a)
Billed business 313
Average spending per proprietary basic card (3) 4
Basic cards-in-force 310
Proprietary consumer card billed business(c) (1) 12
Proprietary small business billed business(c) 715
Proprietary Corporate Services billed business(d) 410
Outside the United States(a)
Billed business 13 12 22 14
Average spending per proprietary basic card 6 4 18 10
Basic cards-in-force 14 15
Proprietary consumer and small business billed business(e) 8 7 14 6
Proprietary Corporate Services billed business(d) 9 8 22 13
(a) Captions in the table above not designated as “proprietary” include both proprietary and Global Network Services data.
(b) Included in the Global Network and Merchant Services segment.
(c) Included in the U.S. Card Services segment.
(d) Included in the Global Commercial Services segment.
(e) Included in the International Card Services segment.
Assuming no changes in foreign exchange rates, total billed
business outside the United States reflected proprietary growth
in Asia Pacific, Canada and Europe in the mid single-digits,
and growth in Latin America in the low double-digits.
The slower growth in overall cards-in-force in 2008 within
both proprietary and GNS reflected modest card acquisition
activities and the effect of certain credit-related actions. In
2008, six million cards were added in the U.S. and non-U.S.
businesses combined. During 2007, discount revenue rose
$1.6 billion or 12 percent to $14.6 billion compared to 2006 as a
result of a 15 percent increase in worldwide billed business, partially
offset by a lower average discount rate, relatively faster growth in
billed business related to GNS, and higher cash-back rewards costs
and corporate incentive payments, which are reported as reductions
to revenue (contra-revenue). The 15 percent increase in worldwide
billed business in 2007 reflected increases in average spending per
proprietary basic card, growth in cards-in-force, and a 49 percent
increase in billed business related to GNS from 2006.
Net card fees increased $231 million or 12 percent to
$2.2 billion in 2008 and $95 million or 5 percent to $1.9 billion
in 2007, primarily reflecting a higher average fee per proprietary
card. In 2007, the increase in net card fees was partially offset
by the reclassification of certain card acquisition-related costs
beginning July 1, 2006, from operating expenses to a reduction
in net card fees.
Travel commissions and fees increased $84 million or
4 percent to $2.0 billion in 2008, primarily reflecting a 3 percent
increase in worldwide travel sales. Travel commissions and fees
in 2007 of $1.9 billion increased $148 million or 8 percent,
reflecting a 13 percent increase in worldwide travel sales
primarily driven by higher airline ticket prices.
Other commissions and fees decreased $110 million or
5 percent to $2.3 billion in 2008 due to the reclassification to
other revenues in USCS of certain card service-related fees
beginning in the first quarter of 2008 and a lower level of
fees related to a lower average balance of owned loans, which
26