American Express 2008 Annual Report Download - page 118
Download and view the complete annual report
Please find page 118 of the 2008 American Express annual report below. You can navigate through the pages in the report by either clicking on the pages listed below, or by using the keyword search tool below to find specific information within the annual report.-
 1
1 -
2
-
3
-
4
-
5
-
6
-
7
-
8
-
9
-
10
-
11
-
12
-
13
-
14
-
15
-
16
-
17
-
18
-
19
-
20
-
21
-
22
-
23
-
24
-
25
-
26
-
27
-
28
-
29
-
30
-
31
-
32
-
33
-
34
-
35
-
36
-
37
-
38
-
39
-
40
-
41
-
42
-
43
-
44
-
45
-
46
-
47
-
48
-
49
-
50
-
51
-
52
-
53
-
54
-
55
-
56
-
57
-
58
-
59
-
60
-
61
-
62
-
63
-
64
-
65
-
66
-
67
-
68
-
69
-
70
-
71
-
72
-
73
-
74
-
75
-
76
-
77
-
78
-
79
-
80
-
81
-
82
-
83
-
84
-
85
-
86
-
87
-
88
-
89
-
90
-
91
-
92
-
93
-
94
-
95
-
96
-
97
-
98
-
99
-
100
-
101
-
102
-
103
-
104
-
105
-
106
-
107
-
 108
108 -
 109
109 -
 110
110 -
 111
111 -
 112
112 -
 113
113 -
 114
114 -
 115
115 -
 116
116 -
 117
117 -
 118
118 -
 119
119 -
 120
120 -
 121
121 -
 122
122 -
 123
123 -
 124
124 -
 125
125
 |
 |

notes to consolidated financial statements
american express company
116
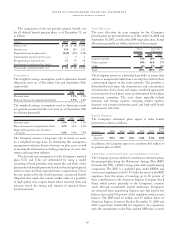
note 26
parent company
Parent Company – Condensed Statements of Income
Years ended December 31
(Millions) 2008 2007 2006
Interest expense net of total revenues $ (170) $ (89) $ (47)
Expenses
Salaries and employee benefits 129 132 136
Other 119 160 184
Total 248 292 320
Pretax loss (418) (381) (367)
Income tax benefit (176) (157) (174)
Net loss before equity in net income of
subsidiaries and affiliates (242) (224) (193)
Equity in net income of subsidiaries
and affiliates 3,113 4,350 3,818
Income from continuing operations 2,871 4,126 3,625
(Loss) Income from discontinued
operations, net of tax (172) (114) 82
Net income $2,699 $4,012 $3,707
Parent Company – Condensed Balance Sheets
As of December 31
(Millions) 2008 2007
Assets
Cash and cash equivalents $ 3 $ 3
Investment securities 594 50
Equity in net assets of subsidiaries
and affiliates of continuing operations 12,563 11,381
Accounts receivable, less reserves 1,153 332
Loan to affiliate in discontinued operations 238 —
Premises and equipment –
at cost, less accumulated
depreciation: 2008, $33; 2007, $27 46 38
Due from subsidiaries 5,928 5,313
Other assets 716 579
Equity in net (liabilities) assets of
subsidiaries and affiliates of
discontinued operations (44) 751
Total assets $21,197 $18,447
Liabilities and Shareholders’ Equity
Accounts payable and other liabilities $ 1,424 $ 672
Long-term debt(a) 7,932 6,746
Total liabilities 9,356 7,418
Shareholders’ equity
Common shares 232 232
Additional paid-in capital 10,496 10,164
Retained earnings 2,719 1,075
Accumulated other comprehensive loss (1,606) (442)
Total shareholders’ equity 11,841 11,029
Total liabilities and shareholders’ equity $21,197 $18,447
(a) Aggregate annual maturities of long-term debt for the five years ending
December 31, 2013, are as follows (millions); 2009, $500; 2010, $0;
2011, $399; 2012, $0; 2013, $997 and thereafter, $6,036. Refer to Note 10
for additional details.
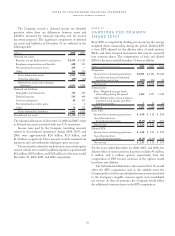
The following table summarizes the Company’s restructuring charges, net of reversals, by reportable segment for the year ended
December 31, 2008, and the cumulative amounts relating to the restructuring programs that were in progress during 2008 and
initiated at various dates between 2006 and 2008.
2008 Cumulative Restructuring Expense Incurred to Date on
in-Progress Restructuring Programs
(Millions)
Total Restructuring
Charges net of reversals Severance Other Tota l
USCS $ 30 $ 54 $ 5 $ 59
ICS 67 90 7 97
GCS 133 142 18 160
GNMS 30 38 1 39
Corporate & Other(a) 157 136 46 182
Total continuing operations 417 460 77 537
Discontinued operations(b) 17———
Total $434 $460 $77 $537(c)
(a) The Corporate & Other segment includes certain fourth quarter 2008 severance and other charges of $133 million related to Company-wide support functions
which were not allocated to the Company’s operating segments, as this was a corporate initiative and is consistent with how such charges were reported internally.
Had the Company allocated these charges to the operating segments, 18 percent would have remained in Corporate & Other while the balance would have been
charged out as follows: USCS (29 percent), ICS (13 percent), GCS (23 percent) and GNMS (17 percent).
(b) Represents severance and other charges related to the disposition of the Company’s international banking subsidiary (AEB).
(c) As of December 31, 2008, the total expenses to be incurred for previously approved restructuring activities that were in progress are not expected to be materially
different than the cumulative expenses incurred to date for these programs.