American Express 2008 Annual Report Download - page 84
Download and view the complete annual report
Please find page 84 of the 2008 American Express annual report below. You can navigate through the pages in the report by either clicking on the pages listed below, or by using the keyword search tool below to find specific information within the annual report.-
 1
1 -
2
-
3
-
4
-
5
-
6
-
7
-
8
-
9
-
10
-
11
-
12
-
13
-
14
-
15
-
16
-
17
-
18
-
19
-
20
-
21
-
22
-
23
-
24
-
25
-
26
-
27
-
28
-
29
-
30
-
31
-
32
-
33
-
34
-
35
-
36
-
37
-
38
-
39
-
40
-
41
-
42
-
43
-
44
-
45
-
46
-
47
-
48
-
49
-
50
-
51
-
52
-
53
-
54
-
55
-
56
-
57
-
58
-
59
-
60
-
61
-
62
-
63
-
64
-
65
-
66
-
67
-
68
-
69
-
70
-
71
-
72
-
73
-
 74
74 -
 75
75 -
 76
76 -
 77
77 -
 78
78 -
 79
79 -
 80
80 -
 81
81 -
 82
82 -
 83
83 -
 84
84 -
 85
85 -
 86
86 -
 87
87 -
 88
88 -
 89
89 -
 90
90 -
 91
91 -
 92
92 -
 93
93 -
 94
94 -
95
-
96
-
97
-
98
-
99
-
100
-
101
-
102
-
103
-
104
-
105
-
106
-
107
-
108
-
109
-
110
-
111
-
112
-
113
-
114
-
115
-
116
-
117
-
118
-
119
-
120
-
121
-
122
-
123
-
124
-
125
 |
 |

notes to consolidated financial statements
american express company
82
fair value
The following is a description of the valuation techniques
utilized by the Company to measure the fair value of its
investment securities, including the general classification
of such items pursuant to the fair value hierarchy. These
techniques may produce fair values that may not be indicative
of a future sale, or reflective of future fair values. The use of
different techniques to determine the fair value of these types
of investment securities could result in different estimates of
fair value at the reporting date. SFAS No. 157 was adopted
by the Company on January 1, 2008; therefore, classification
of the Company’s investments pursuant to the fair value
hierarchy is applicable only to the estimated fair values as of
December 31, 2008.
• When available, quoted market prices are used to determine
fair value and the investment securities are classified within
Level 1 of the fair value hierarchy.
• When quoted prices in an active market are not available, the
fair market values for the Company’s investment securities
are obtained primarily from pricing services engaged by the
Company, and the Company receives one price for each
security. The fair values provided by the pricing services are
estimated by using pricing models, where the inputs to those
models are based on observable market inputs. The inputs
to the valuation techniques applied by the pricing services
vary depending on the type of security being priced but are
typically benchmark yields, benchmark security prices, credit
spreads, prepayment speeds, reported trades, broker-dealer
quotes, all with reasonable levels of transparency. The pricing
services do not apply any adjustments to the pricing models
used, nor does the Company apply any adjustments to prices
received from the pricing services. Although the underlying
inputs are directly observable from active markets or recent
trades of similar securities in inactive markets, the pricing
models used do entail a certain amount of subjectivity and
therefore differing judgements in how the underlying inputs
are modeled could result in different estimates of fair value.
As of December 31, 2008, all of the Company’s investment
securities are classified within Level 2 of the fair value
hierarchy, except for the retained subordinated securities
from the Company’s securitization programs which are
classified within Level 3 of the fair value hierarchy, and are
discussed in more detail in Note 6.
The Company has reaffirmed its understanding of the valuation
techniques used by its pricing services. No adjustments
were deemed necessary to the prices provided by the pricing
services as a result of current market conditions. In addition,
the Company corroborates the prices provided by its pricing
services to test their reasonableness by comparing their prices to
valuations from different pricing sources as well as comparing
prices to the sale prices received from sold securities.
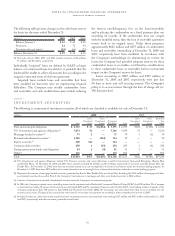
The following table provides information about available-for-sale investment securities with gross unrealized losses and the length
of time that individual securities have been in a continuous unrealized loss position as of December 31, 2008 and 2007:
(Millions) 2008 2007
Less than 12 months 12 months or more Less than 12 months 12 months or more
Description of Securities
Estimated
Fair Value
Gross
Unrealized
Losses
Estimated
Fair Value
Gross
Unrealized
Losses
Estimated
Fair Value
Gross
Unrealized
Losses
Estimated
Fair Value
Gross
Unrealized
Losses
State and municipal obligations $2,515 $(326) $2,037 $(708) $2,680 $(120) $195 $(16)
Retained subordinated securities 744 (584) — — — — — —
Corporate debt securities 35 (1) 99 (12) 110 (2) 116 (2)
Foreign government bonds and obligations 27 (4) — — — — — —
Mortgage-backed securities — — — — — — 20 (1)
Total $3,321 $(915) $2,136 $(720) $2,790 $(122) $331 $(19)
The Company reviews and evaluates investments at least
quarterly and more often as market conditions may require
to identify investments that have indications of other-than-
temporary impairments. The determination of other-than-
temporary impairment is a subjective process, requiring the
use of judgments and assumptions. Accordingly, the Company
considers several metrics when evaluating securities for an
other-than-temporary impairment, including the extent to
which amortized cost exceeds fair value, the duration and size
of that difference, and the issuers credit rating.