American Express 2008 Annual Report Download - page 26
Download and view the complete annual report
Please find page 26 of the 2008 American Express annual report below. You can navigate through the pages in the report by either clicking on the pages listed below, or by using the keyword search tool below to find specific information within the annual report.-
 1
1 -
2
-
3
-
4
-
5
-
6
-
7
-
8
-
9
-
10
-
11
-
12
-
13
-
14
-
15
-
 16
16 -
 17
17 -
 18
18 -
 19
19 -
 20
20 -
 21
21 -
 22
22 -
 23
23 -
 24
24 -
 25
25 -
 26
26 -
 27
27 -
 28
28 -
 29
29 -
 30
30 -
 31
31 -
 32
32 -
 33
33 -
 34
34 -
 35
35 -
 36
36 -
37
-
38
-
39
-
40
-
41
-
42
-
43
-
44
-
45
-
46
-
47
-
48
-
49
-
50
-
51
-
52
-
53
-
54
-
55
-
56
-
57
-
58
-
59
-
60
-
61
-
62
-
63
-
64
-
65
-
66
-
67
-
68
-
69
-
70
-
71
-
72
-
73
-
74
-
75
-
76
-
77
-
78
-
79
-
80
-
81
-
82
-
83
-
84
-
85
-
86
-
87
-
88
-
89
-
90
-
91
-
92
-
93
-
94
-
95
-
96
-
97
-
98
-
99
-
100
-
101
-
102
-
103
-
104
-
105
-
106
-
107
-
108
-
109
-
110
-
111
-
112
-
113
-
114
-
115
-
116
-
117
-
118
-
119
-
120
-
121
-
122
-
123
-
124
-
125
 |
 |

2008 financial review
american express company
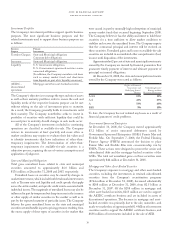
calculation of net interest yield on
cardmember loans(a)
(Millions) 2008 2007
Owned Basis:
Net interest income $3,646 $3,443
Average loans (billions)(c) $ 47.6 $ 47.1
Adjusted net interest income $4,199 $4,182
Adjusted average loans (billions)$ 47.7 $ 47.2
Net interest yield on cardmember loans 8.8 % 8.9%
Managed Basis:
Net interest income(b) $6,328 $5,437
Average loans (billions)(c) $ 75.0 $ 68.2
Adjusted net interest income $6,881 $6,176
Adjusted average loans (billions)$ 75.0 $ 68.3
Net interest yield on cardmember loans 9.2% 9.0%
(a) See Glossary of Selected Terminology for the definitions of certain key
terms and related information.
(b) Includes the GAAP to managed basis securitization adjustments to interest
income and interest expense as set forth under U.S. Card Services Selected
Financial Information managed basis presentation.
(c) Loan balances used to calculate average loans for all periods presented have
been revised in connection with the Company’s conversion to a bank holding
company. Specifically, deferred card fees net of deferred direct acquisition
costs for cardmember loans were reclassified from other liabilities to
cardmember loans for all periods.
The following discussions regarding Consolidated Results of
Operations and Consolidated Liquidity and Capital Resources
are presented on a basis consistent with GAAP unless
otherwise noted.
consolidated results of operations for
the three years ended december 31, 2008
The Company’s 2008 consolidated income from continuing
operations decreased $1.3 billion or 30 percent to $2.9 billion
and diluted earnings per share (EPS) from continuing operations
declined $0.97 or 28 percent to $2.48. Consolidated income
from continuing operations for 2007 increased $501 million
or 14 percent from 2006 and diluted EPS from continuing
operations for 2007 increased $0.52 or 18 percent from 2006.
The Company’s 2008 consolidated net income decreased
$1.3 billion or 33 percent to $2.7 billion, and diluted EPS
decreased $1.03 or 31 percent to $2.33. Consolidated net
income for 2007 and 2006 was $4.0 billion and $3.7 billion,
respectively. Net income for 2008 included a loss of $172 million
from discontinued operations compared to $114 million loss
and $82 million of income from discontinued operations in
2007 and 2006, respectively.
The Company’s revenues, provisions for losses, and
expenses are affected by changes in the relative values of non-
U.S. currencies to the U.S. dollar. The currency rate changes
had a minimal impact on the growth rates of total revenues net
of interest expense, provisions for losses, and total expenses in
2008. Currency rate changes increased the growth rates of total
revenues net of interest expense, provisions for losses, and total
expenses by approximately 2 percent in 2007.
Results from continuing operations for 2008 included:
• A $600 million ($374 million after-tax) addition to U.S.
lending credit reserves reflecting a deterioration of credit
indicators in the second quarter of 2008;
• $449 million ($291 million after-tax) of reengineering costs,
primarily reflecting the restructuring charge related to the
Company’s reengineering initiatives in the fourth quarter
of 2008;
• A $220 million ($138 million after-tax) reduction to the fair
market value of the Company’s interest-only strip; and
• A $106 million ($66 million after-tax) charge in the fourth
quarter of 2008 to increase the Company’s Membership
Rewards liability, in connection with the Company’s
extension of its partnership arrangements with Delta.
Results from continuing operations for 2007 included:
• A $1.13 billion ($700 million after-tax) gain for the initial
payment due March 31, 2008, from Visa as part of the
litigation settlement;
• An $80 million ($50 million after-tax) gain in connection
with the initial adoption of SFAS No. 155, “Accounting for
Certain Hybrid Financial Instruments – an amendment of
FASB Statements No. 133 and 140” (SFAS No. 155);
• A $63 million ($39 million after-tax) gain relating to
amendments to the Company’s U.S. pension plans, effective
July 1, 2007, that reduced projected pension obligations to
plan participants;
• A $685 million ($430 million after-tax) charge related to
enhancements to the method of estimating Membership
Rewards liability;
• A $438 million ($274 million after-tax) credit-related
charge due to experienced deterioration of credit indicators
in the latter part of 2007. This fourth quarter charge was
split between U.S. Card Services’ cardmember lending and
cardmember receivables of $288 million and $96 million,
respectively, and included $54 million relating to a
reduction in the fair market value of the Company’s retained
subordinated interest in securitized cardmember loans;
• $211 million ($131 million after-tax) of incremental
business-building costs;
24