American Express 2008 Annual Report Download - page 121
Download and view the complete annual report
Please find page 121 of the 2008 American Express annual report below. You can navigate through the pages in the report by either clicking on the pages listed below, or by using the keyword search tool below to find specific information within the annual report.-
 1
1 -
2
-
3
-
4
-
5
-
6
-
7
-
8
-
9
-
10
-
11
-
12
-
13
-
14
-
15
-
16
-
17
-
18
-
19
-
20
-
21
-
22
-
23
-
24
-
25
-
26
-
27
-
28
-
29
-
30
-
31
-
32
-
33
-
34
-
35
-
36
-
37
-
38
-
39
-
40
-
41
-
42
-
43
-
44
-
45
-
46
-
47
-
48
-
49
-
50
-
51
-
52
-
53
-
54
-
55
-
56
-
57
-
58
-
59
-
60
-
61
-
62
-
63
-
64
-
65
-
66
-
67
-
68
-
69
-
70
-
71
-
72
-
73
-
74
-
75
-
76
-
77
-
78
-
79
-
80
-
81
-
82
-
83
-
84
-
85
-
86
-
87
-
88
-
89
-
90
-
91
-
92
-
93
-
94
-
95
-
96
-
97
-
98
-
99
-
100
-
101
-
102
-
103
-
104
-
105
-
106
-
107
-
108
-
109
-
110
-
 111
111 -
 112
112 -
 113
113 -
 114
114 -
 115
115 -
 116
116 -
 117
117 -
 118
118 -
 119
119 -
 120
120 -
 121
121 -
 122
122 -
 123
123 -
 124
124 -
 125
125
 |
 |

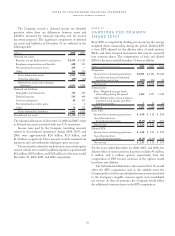
consolidated five-year summary of selected financial data
american express company
119
(Millions, except per share amounts, percentages, and where indicated) 2008 2007 2006 2005 2004
Operating Results(a)
Total revenues net of interest expense $ 28,365 $ 27,559 $ 24,826 $ 22,145 $ 20,168
Expenses 18,986 17,762 17,008 15,605 14,418
Provisions for losses 5,798 4,103 2,666 2,561 2,139
Income from continuing operations 2,871 4,126 3,625 3,014 2,543
(Loss) Income from discontinued operations (172) (114) 82 720 973
Income before cumulative effect of accounting change 2,699 4,012 3,707 3,734 3,516
Net income 2,699 4,012 3,707 3,734 3,445
Return on average equity(b) 22.3% 37.3% 34.7% 25.4% 22.0%
Balance Sheet(a)
Cash and cash equivalents $ 20,547 $ 8,878 $ 3,801 $ 4,272 $ 7,585
Accounts receivable, net 36,571 41,994 38,642 35,293 32,125
Loans, net 40,659 53,339 43,034 33,824 27,596
Investment securities 12,526 13,214 13,207 13,102 12,444
Assets of discontinued operations 216 22,278 20,699 19,866 105,497
Total assets 126,074 149,743 128,262 114,571 194,804
Customer deposits 15,486 15,397 12,011 13,827 10,040
Travelers Cheques outstanding 6,433 7,197 7,215 7,175 7,287
Short-term borrowings 8,993 17,761 15,236 15,711 14,498
Long-term debt 60,041 55,285 42,747 30,781 32,627
Liabilities of discontinued operations 260 21,527 20,003 19,077 97,914
Shareholders’ equity 11,841 11,029 10,511 10,549 16,020
Common Share Statistics
Earnings per share:
Income from continuing operations:
Basic $ 2.49 $ 3.52 $ 2.99 $ 2.44 $ 2.02
Diluted $ 2.48 $ 3.45 $ 2.93 $ 2.40 $ 1.98
(Loss) Income from discontinued operations:
Basic $ (0.15) $ (0.10) $ 0.07 $ 0.59 $ 0.77
Diluted $ (0.15) $ (0.09) $ 0.06 $ 0.57 $ 0.76
Cumulative effect of accounting change, net of tax:
Basic $ — $ — $ — $ — $ (0.05)
Diluted $ — $ — $ — $ — $ (0.06)
Net income:
Basic $ 2.34 $ 3.42 $ 3.06 $ 3.03 $ 2.74
Diluted $ 2.33 $ 3.36 $ 2.99 $ 2.97 $ 2.68
Cash dividends declared per share $ 0.72 $ 0.63 $ 0.57 $ 0.48 $ 0.44
Book value per share $ 10.21 $ 9.53 $ 8.76 $ 8.50 $ 12.83
Market price per share(c):
High $ 52.63 $ 65.89 $ 62.50 $ 59.50 $ 57.05
Low $ 16.55 $ 50.37 $ 49.73 $ 47.01 $ 47.32
Close $ 18.55 $ 52.02 $ 60.67 $ 51.46 $ 56.37
Average common shares outstanding for earnings per share:
Basic 1,154 1,173 1,212 1,233 1,259
Diluted 1,157 1,196 1,238 1,258 1,285
Shares outstanding at period end 1,160 1,158 1,199 1,241 1,249
Other Statistics
Number of employees at period end (thousands):
United States 31 32 32 29 41
Outside United States 35 36 33 37 37
Total (d) 66 68 65 66 78
Number of shareholders of record 43,257 50,216 51,644 55,409 50,394
(a) On November 10, 2008, the Company became a bank holding company under the U.S. Bank Holding Act of 1956. As a result of converting to a bank holding
company, the Company has made certain changes to its Consolidated Statements of Income and Consolidated Balance Sheets and reclassified certain prior period
amounts in order to conform to the current presentation of its financial statements in accordance with the Securities and Exchange Commission’s regulations
applicable to bank holding companies. In 2007, the Company entered into an agreement to sell its international banking subsidiary, AEB, and its subsidiary that
issues investment certificates to AEB’s customers, AEIDC, to Standard Chartered subject to certain regulatory approvals. The results, assets, and liabilities of AEB
(except for certain components of the business which were not sold) are presented as discontinued operations. Additionally, the spin-off of Ameriprise and certain
dispositions were completed in 2006 and 2005, and the results of these operations are presented as discontinued operations. Note 2 provides additional information
on discontinued operations.
(b) Return on average equity is calculated by dividing one year period of net income by one year average of total shareholders’ equity.
(c) The market price per share beginning with the fourth quarter of 2005 reflects the spin-off of Ameriprise as of September 30, 2005. The opening share price on the
first trading day after the spin-off was $50.75.
(d) Amounts include employees from discontinued operations.