American Express 2008 Annual Report Download - page 107
Download and view the complete annual report
Please find page 107 of the 2008 American Express annual report below. You can navigate through the pages in the report by either clicking on the pages listed below, or by using the keyword search tool below to find specific information within the annual report.-
 1
1 -
2
-
3
-
4
-
5
-
6
-
7
-
8
-
9
-
10
-
11
-
12
-
13
-
14
-
15
-
16
-
17
-
18
-
19
-
20
-
21
-
22
-
23
-
24
-
25
-
26
-
27
-
28
-
29
-
30
-
31
-
32
-
33
-
34
-
35
-
36
-
37
-
38
-
39
-
40
-
41
-
42
-
43
-
44
-
45
-
46
-
47
-
48
-
49
-
50
-
51
-
52
-
53
-
54
-
55
-
56
-
57
-
58
-
59
-
60
-
61
-
62
-
63
-
64
-
65
-
66
-
67
-
68
-
69
-
70
-
71
-
72
-
73
-
74
-
75
-
76
-
77
-
78
-
79
-
80
-
81
-
82
-
83
-
84
-
85
-
86
-
87
-
88
-
89
-
90
-
91
-
92
-
93
-
94
-
95
-
96
-
 97
97 -
 98
98 -
 99
99 -
 100
100 -
 101
101 -
 102
102 -
 103
103 -
 104
104 -
 105
105 -
 106
106 -
 107
107 -
 108
108 -
 109
109 -
 110
110 -
 111
111 -
 112
112 -
 113
113 -
 114
114 -
 115
115 -
 116
116 -
 117
117 -
118
-
119
-
120
-
121
-
122
-
123
-
124
-
125
 |
 |

notes to consolidated financial statements
american express company
105
For each plan, the funded status is defined by SFAS
No. 158 as the difference between the fair value of plan assets
(in compliance with SFAS No. 157) and the respective plan’s
projected benefit obligation. The projected benefit obligation
represents a liability based on the plan participant’s service-to-
date and their expected future compensation at their projected
retirement date. Changes in the funded status are recorded as
unrecognized gains and losses, which are recognized in other
comprehensive income, net of tax, in the periods in which they
occur along with prior service cost.
At December 31, 2008, the Company adopted the measurement
requirements of SFAS No. 158, which requires plan assets and
benefit obligations to be measured as of the Company’s fiscal
year-end date. Previously, these amounts were measured (and are
currently reported for 2007) as of September 30. The adoption of
the December 31, 2008 measurement date resulted in 15 months
of defined benefit pension and other postretirement costs being
recognized in 2008. Under SFAS No. 158, the three months of
additional expense is recorded as a charge to retained earnings
of $6 million and a credit to accumulated other comprehensive
income of $3 million.
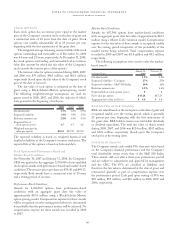
At December 31, 2008, the net underfunded status related
to the plans was $441 million which is based on the 2008
activity shown in the following table:
Net Funded Status
(Millions) 2008 2007
Net funded status, beginning of year(a) $ 113 $(236)
(Decrease) Increase in value of plan assets (900) 210
Decrease in projected benefit obligation 346 139
Net change (554) 349
Funded status (441) 113
Fourth quarter contributions —4
Net amount recognized at December 31,(b) $(441) $ 117
(a) The beginning of the year is as of September 30, which was the measurement
date prior to 2008.
(b) The 2007 balance includes the fourth quarter contributions of $4 million,
which are not included in the 2007 end of year and 2008 beginning of year
amounts shown on the tables in the Plan Assets and Obligations section.
The 2008 change in funded status shown in the above table (from
$113 million overfunded status to $441 million underfunded
status) is caused by a decrease in the fair value of plan assets
of $900 million, partially offset by a decrease in the projected
benefit obligation of $346 million (net $554 million change).
The primary driver of the $554 million change is attributable to
the $461 million market decline in assets. (See Reconciliation
of Change in Fair Value of Plan Assets Table in the Plan Assets
and Obligations section).
The following table provides the funded status amounts
recognized on the Consolidated Balance Sheets as of
December 31:
(Millions) 2008 2007
Other liabilities $(441) $(199)
Other assets —316
Net amount recognized
at December 31, $(441) $ 117
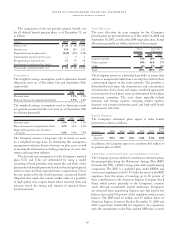
Plan Assets and Obligations
The following tables provide a reconciliation of changes in
the fair value of plan assets and projected benefit obligations
for all plans (2008 changes and end of year amounts are as of
December 31, 2008 and all 2007 amounts and 2008 beginning
of year amounts are as of September 30):
Reconciliation of Change in Fair Value of Plan Assets
(Millions) 2008 2007
Fair value of plan assets,
beginning of year $2,593 $2,383
Effect of transition to December 31st
measurement date 11 —
Actual return on plan assets (461) 304
Employer contributions 20 29
Benefits paid (61) (52)
Settlements (88) (93)
Foreign currency exchange rate changes (321) 22
Net change (900) 210
Fair value of plan assets,
end of year $1,693 $2,593
Reconciliation of Change in Projected Benefit Obligation
(Millions) 2008 2007
Projected benefit obligation,
beginning of year $2,480 $2,619
Effect of transition
to December 31st
measurement date 6—
Service cost 23 93
Interest cost 136 138
Benefits paid (61) (52)
Actuarial gain (56) (163)
Plan amendments (4) 2
Settlements/curtailments (93) (185)
Foreign currency exchange rate changes (297 ) 28
Net change (346) (139)
Projected benefit obligation, end of year $2,134 $2,480