American Express 2008 Annual Report Download - page 120
Download and view the complete annual report
Please find page 120 of the 2008 American Express annual report below. You can navigate through the pages in the report by either clicking on the pages listed below, or by using the keyword search tool below to find specific information within the annual report.-
 1
1 -
2
-
3
-
4
-
5
-
6
-
7
-
8
-
9
-
10
-
11
-
12
-
13
-
14
-
15
-
16
-
17
-
18
-
19
-
20
-
21
-
22
-
23
-
24
-
25
-
26
-
27
-
28
-
29
-
30
-
31
-
32
-
33
-
34
-
35
-
36
-
37
-
38
-
39
-
40
-
41
-
42
-
43
-
44
-
45
-
46
-
47
-
48
-
49
-
50
-
51
-
52
-
53
-
54
-
55
-
56
-
57
-
58
-
59
-
60
-
61
-
62
-
63
-
64
-
65
-
66
-
67
-
68
-
69
-
70
-
71
-
72
-
73
-
74
-
75
-
76
-
77
-
78
-
79
-
80
-
81
-
82
-
83
-
84
-
85
-
86
-
87
-
88
-
89
-
90
-
91
-
92
-
93
-
94
-
95
-
96
-
97
-
98
-
99
-
100
-
101
-
102
-
103
-
104
-
105
-
106
-
107
-
108
-
109
-
 110
110 -
 111
111 -
 112
112 -
 113
113 -
 114
114 -
 115
115 -
 116
116 -
 117
117 -
 118
118 -
 119
119 -
 120
120 -
 121
121 -
 122
122 -
 123
123 -
 124
124 -
 125
125
 |
 |

notes to consolidated financial statements
american express company
118
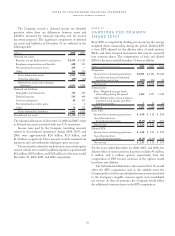
note 28
quarterly financial data (unaudited)
(Millions, except per share amounts) 2008(a) 2007(a)
Quarters Ended 12/31 9/30 6/30 3/31 12/31 9/30(b) 6/30 3/31
Total revenues net of interest expense $6,506 $7,164 $7,455 $7,240 $7,324 $6,956 $ 6,867 $6,412
Pretax income from continuing operations 268 1,078 774 1,461 1,158 1,505 1,415 1,616
Income from continuing operations 306 861 660 1,044 858 1,122 1,046 1,100
(Loss) Income from discontinued operations, net of tax (66) (46) (7) (53) (27) (55) 11 (43)
Net income 240 815 653 991 831 1,067 1,057 1,057
Earnings Per Common Share — Basic:
Continuing operations $ 0.27 $ 0.75 $ 0.57 $ 0.91 $ 0.74 $ 0.96 $ 0.89 $ 0.93
Discontinued operations (0.06) (0.04) — (0.05) (0.02) (0.05) 0.01 (0.04)
Net income $ 0.21 $ 0.71 $ 0.57 $ 0.86 $ 0.72 $ 0.91 $ 0.90 $ 0.89
Earnings Per Common Share — Diluted:
Continuing operations $ 0.27 $ 0.74 $ 0.57 $ 0.90 $ 0.73 $ 0.94 $ 0.87 $ 0.91
Discontinued operations (0.06) (0.04) (0.01) (0.05) (0.02) (0.04) 0.01 (0.04)
Net income $ 0.21 $ 0.70 $ 0.56 $ 0.85 $ 0.71 $ 0.90 $ 0.88 $ 0.87
Cash dividends declared per common share $ 0.18 $ 0.18 $ 0.18 $ 0.18 $ 0.18 $ 0.15 $ 0.15 $ 0.15
Common share price:
High $35.80 $42.50 $52.63 $52.32 $63.63 $65.89 $65.24 $61.90
Low $16.55 $31.68 $37.61 $39.50 $50.37 $55.50 $55.34 $53.91
(a) Note 2 provides additional information on discontinued operations.
(b) Diluted EPS from discontinued operations was greater than basic EPS from discontinued operations due to the impact of rounded fractional amounts.
note 27
subsequent event
In October 2008, the United States Department of the Treasury
(Treasury Department) announced its Capital Purchase
Program (CPP) under the Emergency Economic Stabilization
Act of 2008 (EESA).
Subsequent to year-end 2008, the Company participated in
the CPP by issuing to the Treasury Department 3,388,890 shares
of the Company’s Series A Fixed Rate Cumulative Perpetual
Preferred Stock, along with a ten-year warrant (Warrant) to
purchase up to 24,264,129 shares of common stock at an initial
per share exercise price of $20.95 per share. The aggregate gross
proceeds received by the Company on January 9, 2009 for the
Series A Preferred Stock and Warrant totaled $3.39 billion.
As of January 9, 2009, both the Series A Preferred Stock
and Warrant are accounted for as permanent equity and are
components of Tier 1 capital, thus enhancing the Company’s
Tier 1 and Total Capital ratios.