American Express 2008 Annual Report Download - page 81
Download and view the complete annual report
Please find page 81 of the 2008 American Express annual report below. You can navigate through the pages in the report by either clicking on the pages listed below, or by using the keyword search tool below to find specific information within the annual report.-
 1
1 -
2
-
3
-
4
-
5
-
6
-
7
-
8
-
9
-
10
-
11
-
12
-
13
-
14
-
15
-
16
-
17
-
18
-
19
-
20
-
21
-
22
-
23
-
24
-
25
-
26
-
27
-
28
-
29
-
30
-
31
-
32
-
33
-
34
-
35
-
36
-
37
-
38
-
39
-
40
-
41
-
42
-
43
-
44
-
45
-
46
-
47
-
48
-
49
-
50
-
51
-
52
-
53
-
54
-
55
-
56
-
57
-
58
-
59
-
60
-
61
-
62
-
63
-
64
-
65
-
66
-
67
-
68
-
69
-
70
-
 71
71 -
 72
72 -
 73
73 -
 74
74 -
 75
75 -
 76
76 -
 77
77 -
 78
78 -
 79
79 -
 80
80 -
 81
81 -
 82
82 -
 83
83 -
 84
84 -
 85
85 -
 86
86 -
 87
87 -
 88
88 -
 89
89 -
 90
90 -
 91
91 -
92
-
93
-
94
-
95
-
96
-
97
-
98
-
99
-
100
-
101
-
102
-
103
-
104
-
105
-
106
-
107
-
108
-
109
-
110
-
111
-
112
-
113
-
114
-
115
-
116
-
117
-
118
-
119
-
120
-
121
-
122
-
123
-
124
-
125
 |
 |

notes to consolidated financial statements
american express company
79
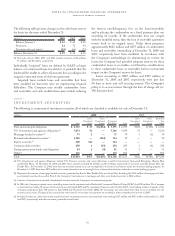
assets and liabilities of discontinued operations measured at fair value on a
recurring basis:
As described in Note 1, on January 1, 2008, the Company partially adopted SFAS No. 157 for its financial assets and financial
liabilities that are accounted for at fair value. The fair value measurement and disclosure provisions of SFAS No. 157 are prospective
in nature and, therefore, apply to financial assets and financial liabilities included in discontinued operations from January 1, 2008,
forward. The following table presents the AEIDC financial instruments carried at fair value at December 31, 2008 and the respective
SFAS No. 157 fair value hierarchy level:
(Millions)
Total Carrying Value included in Assets
of Discontinued Operations on the
Consolidated Balance Sheet
at December 31, 2008
Fair Value
Hierarchy Level
Residential mortgage-backed securities
Non-Government Sponsored Entities:
Prime(a) $ 46 2
Alt-A(a) 159 2
Total residential mortgage-backed securities 205
Other asset-backed securities(b) 83
Total investments at fair value $213
(a) The fair market values were obtained from pricing services engaged by the Company. The Company receives one price for each security. The fair values provided
by the pricing services are estimated by using pricing models, where the inputs to those models are based on observable market inputs. The inputs to the valuation
techniques applied by the pricing services vary depending on the type of security being priced but are typically benchmark yield, benchmark security prices, credit
spreads, prepayment speeds, reported trades, broker-dealer quotes, all with reasonable levels of transparency. The pricing models used generally do not entail
substantial subjectivity because the methodologies employed use inputs observed from active markets or recent trades of similar securities in inactive markets.
The pricing services do not apply any adjustments to the pricing models used, nor does the Company apply any adjustments to prices received from the pricing
services. The Company has reaffirmed its understanding of the valuation techniques used by its pricing services. No adjustments were deemed necessary to the
prices provided by the pricing services as a result of current market conditions. The use of different techniques (e.g., different pricing models) to determine the fair
value of these investments could result in different estimates of fair value at the reporting date.
(b) Represents investments in other asset-backed securities transferred in the second quarter of 2008 from Level 2 into Level 3 of the fair value hierarchy primarily
due to the significant inputs to the fair value of these assets being unobservable as a result of limited marketplace activity. The value of these assets was $24 million
when they were transferred into Level 3 during the second quarter of 2008. Since then, the Company had $10 million in net settlements and $6 million in realized
losses, reducing the value of these investments to $8 million.