American Express 2008 Annual Report Download - page 49
Download and view the complete annual report
Please find page 49 of the 2008 American Express annual report below. You can navigate through the pages in the report by either clicking on the pages listed below, or by using the keyword search tool below to find specific information within the annual report.-
 1
1 -
2
-
3
-
4
-
5
-
6
-
7
-
8
-
9
-
10
-
11
-
12
-
13
-
14
-
15
-
16
-
17
-
18
-
19
-
20
-
21
-
22
-
23
-
24
-
25
-
26
-
27
-
28
-
29
-
30
-
31
-
32
-
33
-
34
-
35
-
36
-
37
-
38
-
 39
39 -
 40
40 -
 41
41 -
 42
42 -
 43
43 -
 44
44 -
 45
45 -
 46
46 -
 47
47 -
 48
48 -
 49
49 -
 50
50 -
 51
51 -
 52
52 -
 53
53 -
 54
54 -
 55
55 -
 56
56 -
 57
57 -
 58
58 -
 59
59 -
60
-
61
-
62
-
63
-
64
-
65
-
66
-
67
-
68
-
69
-
70
-
71
-
72
-
73
-
74
-
75
-
76
-
77
-
78
-
79
-
80
-
81
-
82
-
83
-
84
-
85
-
86
-
87
-
88
-
89
-
90
-
91
-
92
-
93
-
94
-
95
-
96
-
97
-
98
-
99
-
100
-
101
-
102
-
103
-
104
-
105
-
106
-
107
-
108
-
109
-
110
-
111
-
112
-
113
-
114
-
115
-
116
-
117
-
118
-
119
-
120
-
121
-
122
-
123
-
124
-
125
 |
 |

2008 financial review
american express company
Results of the business segments essentially treat each
segment as a stand-alone business. The management reporting
process that derives these results allocates income and expense
using various methodologies as described below.
total revenues net of interest expense
The Company allocates discount revenue and certain other
revenues among segments using a transfer pricing methodology.
Segments earn discount revenue based on the volume of
merchant business generated by cardmembers. Within the
USCS, ICS, and GCS segments, discount revenue reflects
the issuer component of the overall discount rate; within the
GNMS segment, discount revenue reflects the network and
merchant component of the overall discount rate. Total interest
income and net card fees are directly attributable to the segment
in which they are reported.
provisions for losses
The provisions for losses are directly attributable to the segment
in which they are reported.
expenses
Marketing and promotion expenses are reflected in each segment
based on actual expenses incurred, with the exception of brand
advertising, which is reflected in the GNMS segment. Rewards
and cardmember services expenses are reflected in each segment
based on actual expenses incurred within each segment.
Salaries and employee benefits and other operating expenses,
such as professional services, occupancy and equipment and
communications, reflect expenses incurred directly within
each segment. In addition, expenses related to the Company’s
support services, such as technology costs, are allocated to each
segment based on support service activities directly attributable
to the segment. Other overhead expenses, such as staff group
support functions, are allocated to segments based on each
segment’s relative level of pretax income, with the exception
of certain fourth quarter 2008 severance and other charges
of $133 million related to the Company’s fourth quarter
reengineering initiative. These charges were reflected in the
Corporate & Other segment as this was a corporate initiative,
which is further discussed in Note 25 to the Consolidated
Financial Statements and earlier in the Financial Review.
This presentation is consistent with how such charges were
reported internally. Financing requirements are managed on
a consolidated basis. Funding costs are allocated based on
segment funding requirements.
capital
Each business segment is allocated capital based on established
business model operating requirements, risk measures, and
regulatory capital requirements. Business model operating
requirements include capital needed to support operations
and specific balance sheet items. The risk measures include
considerations for credit, market, and operational risk.
income taxes
Income tax provision (benefit) is allocated to each business
segment based on the effective tax rates applicable to various
businesses that make up the segment.
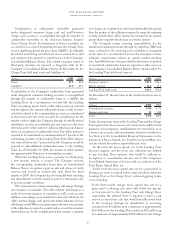
u.s. card services
selected income statement data
gaap basis presentation
Years Ended December 31,
(Millions) 2008 2007 2006
Revenues
Discount revenue, net card
fees and other $10,357 $10,243 $ 9,286
Securitization income, net 1,070 1,507 1,489
Interest income 4,736 5,125 3,688
Interest expense 2,166 2,653 1,843
Net interest income 2,570 2,472 1,845
Total revenues net of interest
expense 13,997 14,222 12,620
Provisions for losses 4,389 2,998 1,625
Total revenues net of interest
expense after provision for losses 9,608 11,224 10,995
Expenses
Marketing, promotion, rewards and
cardmember services 4,837 5,140 4,445
Salaries and employee benefits and
other operating expenses 3,630 3,354 3,227
Total 8,467 8,494 7,672
Pretax segment income 1,141 2,730 3,323
Income tax provision 289 907 1,171
Segment income $ 852 $ 1,823 $ 2,152
47