American Express 2008 Annual Report Download - page 56
Download and view the complete annual report
Please find page 56 of the 2008 American Express annual report below. You can navigate through the pages in the report by either clicking on the pages listed below, or by using the keyword search tool below to find specific information within the annual report.-
 1
1 -
2
-
3
-
4
-
5
-
6
-
7
-
8
-
9
-
10
-
11
-
12
-
13
-
14
-
15
-
16
-
17
-
18
-
19
-
20
-
21
-
22
-
23
-
24
-
25
-
26
-
27
-
28
-
29
-
30
-
31
-
32
-
33
-
34
-
35
-
36
-
37
-
38
-
39
-
40
-
41
-
42
-
43
-
44
-
45
-
 46
46 -
 47
47 -
 48
48 -
 49
49 -
 50
50 -
 51
51 -
 52
52 -
 53
53 -
 54
54 -
 55
55 -
 56
56 -
 57
57 -
 58
58 -
 59
59 -
 60
60 -
 61
61 -
 62
62 -
 63
63 -
 64
64 -
 65
65 -
 66
66 -
67
-
68
-
69
-
70
-
71
-
72
-
73
-
74
-
75
-
76
-
77
-
78
-
79
-
80
-
81
-
82
-
83
-
84
-
85
-
86
-
87
-
88
-
89
-
90
-
91
-
92
-
93
-
94
-
95
-
96
-
97
-
98
-
99
-
100
-
101
-
102
-
103
-
104
-
105
-
106
-
107
-
108
-
109
-
110
-
111
-
112
-
113
-
114
-
115
-
116
-
117
-
118
-
119
-
120
-
121
-
122
-
123
-
124
-
125
 |
 |

2008 financial review
american express company
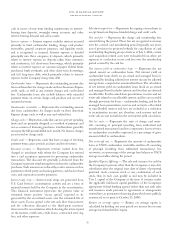
selected statistical information(a)
Years Ended December 31,
(Billions, except percentages
and where indicated) 2008 2007 2006
Card billed business $ 129.2 $ 122.1 $ 106.9
Total cards-in-force (millions) 7.1 6.8 6.7
Basic cards-in-force (millions) 7.1 6.8 6.7
Average basic cardmember
spending (dollars) $18,527 $18,017 $16,264
Global Corporate Travel:
Travel sales $ 21.0 $ 20.5 $ 18.5
Travel commissions and
fees/sales 7.8% 7.7% 8.1%
Total segment assets $ 25.1 $ 21.1 $ 18.9
Segment capital (millions)(b) $ 3,550 $ 2,239 $ 1,907
Return on average segment capital(c) 15.8% 25.3% 25.7%
Return on average tangible
segment capital(c) 34.3% 43.3% 42.8%
Cardmember receivables:
Total receivables $ 9.4 $ 11.4 $ 10.3
90 days past due as a % of total 2.7% 2.1% 1.9%
Net loss ratio as a % of
charge volume 0.13% 0.10% 0.09%
(a) See Glossary of Selected Terminology for the definitions of certain key
terms and related information.
(b) Segment capital represents capital allocated to a segment based upon
specific business operational needs, risk measures, and regulatory capital
requirements.
(c) Return on average segment capital is calculated by dividing (i) segment
income ($505 million, $536 million, and $477 million for 2008, 2007, and
2006, respectively) by (ii) average segment capital ($3.2 billion, $2.1 billion,
and $1.9 billion for 2008, 2007, and 2006, respectively). Return on average
tangible segment capital is computed in the same manner as return on
average segment capital except the computation of average tangible segment
capital excludes average goodwill and other intangibles of $1.7 billion,
$881 million, and $743 million at December 31, 2008, 2007, and 2006,
respectively. The Company believes the return on average tangible segment
capital is a useful measure of the profitability of its business growth.
results of operations for the three
years ended december 31, 2008
Global Commercial Services reported segment income of
$505 million for 2008, a $31 million or 6 percent decrease
from $536 million in 2007, which increased $59 million or
12 percent from 2006.
Total Revenues Net of Interest Expense
In 2008, Global Commercial Services’ total revenues net
of interest expense increased $427 million or 10 percent to
$4.7 billion due to increased discount revenue, net card fees, and
other revenues and lower interest expense. Discount revenue,
net card fees, and other revenues increased $384 million or
8 percent to $5.1 billion in 2008 primarily due to higher other
revenues, driven partially by the CPS acquisition and greater
discount and travel revenues. The 6 percent increase in billed
business in 2008 reflected a 3 percent increase in average
spending per proprietary basic card and a 4 percent increase in
basic cards-in-force. Assuming no changes in foreign currency
exchange rates from 2007 to 2008, billed business and average
spending per proprietary basic card increased 5 percent and
2 percent, respectively, in 2008 and volume growth within
the United States of 4 percent compared to growth within
the Company’s other major geographic regions ranging from
the mid single-digits in Europe and Asia Pacific, to the low
double-digits in Canada and the high teens in Latin America.
Interest expense decreased $62 million or 10 percent to
$553 million in 2008 due to a lower cost of funds, primarily
within the United States, partially offset by the cost of funding
the CPS acquisition. Total revenues net of interest expense of
$4.3 billion in 2007 were $369 million or 9 percent higher
than 2006 as a result of increased discount revenue, net card
fees, and other, partially offset by higher interest expense.
Provisions for Losses
Provisions for losses increased $68 million or 42 percent to
$231 million in 2008 compared to 2007, reflecting higher loss
and past due rates due to the challenging economic environment.
Provisions for losses increased $50 million or 44 percent to
$163 million in 2007 compared to 2006 due to higher volumes
and loss rates.
Expenses
During 2008, Global Commercial Services’ expenses increased
$410 million or 12 percent to $3.8 billion, due to higher salaries
and employee benefits and other operating expenses. Expenses
in 2008, 2007, and 2006, included $138 million, $25 million,
and $58 million, respectively, of reengineering costs primarily
reflecting the Company’s reengineering initiatives in 2008
as previously discussed and reengineering costs primarily
in business travel in 2007 and 2006. Expenses in 2007 of
$3.4 billion were $291 million or 9 percent higher than 2006
primarily due to greater salaries and employee benefits and
other operating expenses and higher marketing, promotion,
rewards and cardmember services expenses.
Marketing, promotion, rewards and cardmember services
expenses decreased $10 million or 3 percent to $377 million
in 2008, primarily due to the Membership Rewards related
charge in 2007, offset by higher volume-related rewards
costs and the Delta related charge in 2008 to increase the
Membership Rewards liability. Marketing, promotion, rewards
and cardmember services expenses increased $80 million or
26 percent to $387 million in 2007, primarily reflecting higher
Membership Rewards liability resulting from enhancements
to the method of liability estimation, partially offset by the
adjustments made to the Membership Rewards reserve models
in 2006. Salaries and employee benefits and other operating
54