American Express 2008 Annual Report Download - page 113
Download and view the complete annual report
Please find page 113 of the 2008 American Express annual report below. You can navigate through the pages in the report by either clicking on the pages listed below, or by using the keyword search tool below to find specific information within the annual report.-
 1
1 -
2
-
3
-
4
-
5
-
6
-
7
-
8
-
9
-
10
-
11
-
12
-
13
-
14
-
15
-
16
-
17
-
18
-
19
-
20
-
21
-
22
-
23
-
24
-
25
-
26
-
27
-
28
-
29
-
30
-
31
-
32
-
33
-
34
-
35
-
36
-
37
-
38
-
39
-
40
-
41
-
42
-
43
-
44
-
45
-
46
-
47
-
48
-
49
-
50
-
51
-
52
-
53
-
54
-
55
-
56
-
57
-
58
-
59
-
60
-
61
-
62
-
63
-
64
-
65
-
66
-
67
-
68
-
69
-
70
-
71
-
72
-
73
-
74
-
75
-
76
-
77
-
78
-
79
-
80
-
81
-
82
-
83
-
84
-
85
-
86
-
87
-
88
-
89
-
90
-
91
-
92
-
93
-
94
-
95
-
96
-
97
-
98
-
99
-
100
-
101
-
102
-
 103
103 -
 104
104 -
 105
105 -
 106
106 -
 107
107 -
 108
108 -
 109
109 -
 110
110 -
 111
111 -
 112
112 -
 113
113 -
 114
114 -
 115
115 -
 116
116 -
 117
117 -
 118
118 -
 119
119 -
 120
120 -
 121
121 -
 122
122 -
 123
123 -
124
-
125
 |
 |

notes to consolidated financial statements
american express company
111
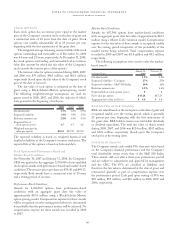
The Company records a deferred income tax (benefit)
provision when there are differences between assets and
liabilities measured for financial reporting and for income
tax return purposes. The significant components of deferred
tax assets and liabilities at December 31 are reflected in the
following table:
(Millions) 2008 2007
Deferred tax assets:
Reserves not yet deducted for tax purposes $3,559 $3,175
Employee compensation and benefits 680 503
Net unrealized securities losses 458 —
Other 246 210
Gross deferred tax assets 4,943 3,888
Valuation allowance (69) (60)
Deferred tax assets after valuation
allowance 4,874 3,828
Deferred tax liabilities:
Intangibles and fixed assets 713 633
Deferred revenue 531 499
Asset securitizations 84 107
Net unrealized securities gains —6
Other 76 172
Gross deferred tax liabilities 1,404 1,417
Net deferred tax assets $3,470 $2,411
The valuation allowances at December 31, 2008 and 2007, relate
to deferred tax assets associated with non-U.S. operations.
Income taxes paid by the Company (including amounts
related to discontinued operations) during 2008, 2007, and
2006, were approximately $2.0 billion, $1.8 billion, and
$1.4 billion, respectively. These amounts include estimated tax
payments and cash settlements relating to prior tax years.
The tax benefit realized for tax deductions from stock option
exercises which are recorded in additional paid-in capital totaled
$21 million, $158 million, and $128 million for the years ended
December 31, 2008, 2007, and 2006, respectively.
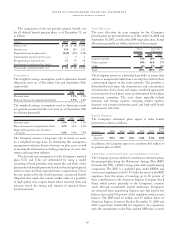
note 22
earnings per common
share (eps)
Basic EPS is computed by dividing net income by the average
weighted shares outstanding during the period. Diluted EPS
is basic EPS adjusted for the dilutive effect of stock options,
RSAs, and other financial instruments that may be converted
into common shares. The computations of basic and diluted
EPS for the years ended December 31 were as follows:
(Millions, except per share amounts) 2008 2007 2006
Numerator:
Income from continuing operations $2,871 $4,126 $3,625
(Loss) Income from discontinued
operations, net of tax (172) (114) 82
Net income $2,699 $4,012 $3,707
Denominator:
Basic: Weighted-average shares
outstanding during the period 1,154 1,173 1,212
Add: Dilutive effect of stock options,
restricted stock awards and other
dilutive securities 323 26
Diluted 1,157 1,196 1,238
Basic EPS:
Income from continuing operations $ 2.49 $ 3.52 $ 2.99
(Loss) Income from
discontinued operations (0.15) (0.10) 0.07
Net income $ 2.34 $ 3.42 $ 3.06
Diluted EPS:
Income from continuing operations $ 2.48 $ 3.45 $ 2.93
(Loss) Income from
discontinued operations (0.15) (0.09) 0.06
Net income $ 2.33 $ 3.36 $ 2.99
For the years ended December 31, 2008, 2007, and 2006, the
dilutive effect of unexercised stock options excludes 45 million,
8 million, and 6 million options, respectively, from the
computation of EPS because inclusion of the options would
have been anti-dilutive.
The Subordinated Debentures, discussed in Note 10, would
affect the EPS computation only in the unlikely event the
Company fails to achieve specified performance measures related
to the Company’s tangible common equity and consolidated
net income. In that circumstance the Company would reflect
the additional common shares in the EPS computation.