American Express 2013 Annual Report Download - page 3
Download and view the complete annual report
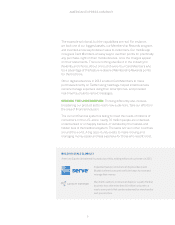
Please find page 3 of the 2013 American Express annual report below. You can navigate through the pages in the report by either clicking on the pages listed below, or by using the keyword search tool below to find specific information within the annual report.-
 1
1 -
 2
2 -
 3
3 -
 4
4 -
 5
5 -
 6
6 -
 7
7 -
 8
8 -
 9
9 -
 10
10 -
 11
11 -
 12
12 -
 13
13 -
 14
14 -
15
-
16
-
17
-
18
-
19
-
20
-
21
-
22
-
23
-
24
-
25
-
26
-
27
-
28
-
29
-
30
-
31
-
32
-
33
-
34
-
35
-
36
-
37
-
38
-
39
-
40
-
41
-
42
-
43
-
44
-
45
-
46
-
47
-
48
-
49
-
50
-
51
-
52
-
53
-
54
-
55
-
56
-
57
-
58
-
59
-
60
-
61
-
62
-
63
-
64
-
65
-
66
-
67
-
68
-
69
-
70
-
71
-
72
-
73
-
74
-
75
-
76
-
77
-
78
-
79
-
80
-
81
-
82
-
83
-
84
-
85
-
86
-
87
-
88
-
89
-
90
-
91
-
92
-
93
-
94
-
95
-
96
-
97
-
98
-
99
-
100
-
101
-
102
-
103
-
104
-
105
-
106
-
107
-
108
-
109
-
110
-
111
-
112
-
113
-
114
 |
 |

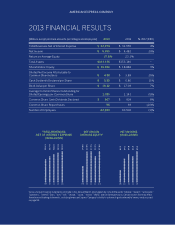
$24.3
$27.6
$30.0
$31.6
$33.0
1312111009 1312111009
14.6%
27.5%
27.7%
23.1%
27.8%
1312111009
(Millions, except per share amounts, percentages and employees) 2013 2012 % INC/(DEC)
Total Revenues Net of Interest Expense 32,974
Net Income $ 5,359
Return on Average Equity 27.8%
Total Assets $ 153,375 –
Shareholders’ Equity $ 19,496
Diluted Net Income Attributable to
Common Shareholders $ 4.88
Cash Dividends Declared per Share $ 0.89
Book Value per Share $ 18.32
Average Common Shares Outstanding for
Diluted Earnings per Common Share 1,089
Common Share Cash Dividends Declared $ 967
Common Share Repurchases 55
Number of Employees 62,800
2013 FINANCIAL RESULTS
Various forward-looking statements are made in this Annual Report, which generally include the words “believe,” “expect,” “anticipate,”
“optimistic,” “intend,” “plan,” “aim,” “will,” “should,” “could,” “would,” “likely,” and similar expressions. Certain factors that may affect
these forward-looking statements, including American Express Company’s ability to achieve its goals referred to herein, are discussed
on page 54.
TOTAL REVENUES
NET OF INTEREST EXPENSE
(IN BILLIONS)
RETURN ON
AVERAGE EQUITY
NET INCOME
(IN BILLIONS)
AMERICAN EXPRESS COMPANY