American Express 2013 Annual Report Download - page 30
Download and view the complete annual report
Please find page 30 of the 2013 American Express annual report below. You can navigate through the pages in the report by either clicking on the pages listed below, or by using the keyword search tool below to find specific information within the annual report.-
 1
1 -
2
-
3
-
4
-
5
-
6
-
7
-
8
-
9
-
10
-
11
-
12
-
13
-
14
-
15
-
16
-
17
-
18
-
19
-
 20
20 -
 21
21 -
 22
22 -
 23
23 -
 24
24 -
 25
25 -
 26
26 -
 27
27 -
 28
28 -
 29
29 -
 30
30 -
 31
31 -
 32
32 -
 33
33 -
 34
34 -
 35
35 -
 36
36 -
 37
37 -
 38
38 -
 39
39 -
 40
40 -
41
-
42
-
43
-
44
-
45
-
46
-
47
-
48
-
49
-
50
-
51
-
52
-
53
-
54
-
55
-
56
-
57
-
58
-
59
-
60
-
61
-
62
-
63
-
64
-
65
-
66
-
67
-
68
-
69
-
70
-
71
-
72
-
73
-
74
-
75
-
76
-
77
-
78
-
79
-
80
-
81
-
82
-
83
-
84
-
85
-
86
-
87
-
88
-
89
-
90
-
91
-
92
-
93
-
94
-
95
-
96
-
97
-
98
-
99
-
100
-
101
-
102
-
103
-
104
-
105
-
106
-
107
-
108
-
109
-
110
-
111
-
112
-
113
-
114
 |
 |

AMERICAN EXPRESS COMPANY
2013 FINANCIAL REVIEW
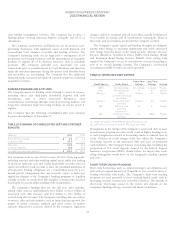
INTERNATIONAL CARD SERVICES SEGMENT
TABLE 11: ICS SELECTED INCOME STATEMENT DATA
Years Ended December 31,
(Millions, except percentages) 2013 2012 2011
Change
2013 vs. 2012
Change
2012 vs. 2011
Revenues
Discount revenue, net card fees and other $ 4,644 $ 4,561 $ 4,470 $ 83 2% $ 91 2%
Interest income 1,118 1,147 1,195 (29) (3) (48) (4)
Interest expense 361 402 426 (41) (10) (24) (6)
Net interest income 757 745 769 12 2 (24) (3)
Total revenues net of interest expense 5,401 5,306 5,239 95 2 67 1
Provisions for losses 444 330 268 114 35 62 23
Total revenues net of interest expense after provisions for losses 4,957 4,976 4,971 (19) — 5 —
Expenses
Marketing, promotion, rewards and Card Member services 2,013 1,927 1,857 86 4 70 4
Salaries and employee benefits and other operating expenses 2,301 2,390 2,352 (89) (4) 38 2
Total expenses 4,314 4,317 4,209 (3) — 108 3
Pretax segment income 643 659 762 (16) (2) (103) (14)
Income tax provision 12 25 39 (13) (52) (14) (36)
Segment income $ 631 $ 634 $ 723 $ (3) —% $ (89) (12)%
Effective tax rate 1.9% 3.8% 5.1%
ICS issues proprietary consumer and small business cards outside the
U.S.
TOTAL REVENUES NET OF INTEREST EXPENSE
Discount revenue, net card fees and other revenues increased $83
million or 2 percent in 2013 as compared to the prior year, primarily
due to an increase in net card fees, as well as higher Loyalty Partner
commissions and fees and foreign exchange conversion fee revenue.
Excluding the impact of changes in foreign exchange rates, discount
revenue, net card fees and other revenues increased 6 percent in 2013
as compared to the prior year.3
Billed business increased 2 percent in 2013 as compared to the
prior year, primarily reflecting an increase in average spending per
proprietary basic card. Excluding the impact of changes in foreign
exchange rates, billed business increased 6 percent in 2013 as
compared to the prior year. Refer to Table 6 for additional
information on billed business by region.
Interest income decreased $29 million or 3 percent in 2013 as
compared to the prior year, primarily due to lower average Card
Member loans as well as charges related to Card Member
reimbursements in 2013. Excluding the impact of changes in foreign
exchange rates, interest income increased 1 percent in 2013 as
compared to the prior year.3
Interest expense decreased $41 million or 10 percent in 2013 as
compared to the prior year, reflecting a lower cost of funds. Excluding
the impact of changes in foreign exchange rates, interest expense
decreased 6 percent in 2013 as compared to the prior year.3
Total revenues net of interest expense increased $67 million or 1
percent in 2012 as compared to the prior year, primarily due to higher
discount revenue, net card fees and other revenues, partially offset by
lower net interest income.
PROVISIONS FOR LOSSES
Provisions for losses increased $114 million or 35 percent in 2013 as
compared to the prior year, primarily driven by a higher provision for
both charge cards and Card Member loans. The increase in charge
card provision reflects higher average receivables resulting in higher
net write-offs and a reserve build in 2013. The increase in Card
Member loans provision reflects a lower reserve release compared to
the prior year, partially offset by lower net write-offs. Excluding the
impact of changes in foreign exchange rates, provisions for losses
increased 38 percent in 2013 as compared to the prior year.3
Provisions for losses increased $62 million or 23 percent in 2012 as
compared to the prior year, primarily driven by higher Card Member
loans provision due to lower reserve releases in 2012, partially offset
by lower charge card provision and lower Card Member lending net
write-off rates.
Refer to Table 12 for the lending and charge write-off rates for
2013, 2012 and 2011.
EXPENSES
Marketing, promotion, rewards and Card Member services expenses
increased $86 million or 4 percent in 2013 as compared to the prior
year, driven primarily by higher Card Member rewards expenses,
which includes a charge related to a change in the International
Membership Rewards URR estimation process for certain
international countries, as well as higher marketing and promotion
expenses. Excluding the impact of changes in foreign exchange rates,
marketing, promotion, rewards and Card Member services expenses
increased 8 percent in 2013 as compared to the prior year.3Marketing,
promotion, rewards and Card Member services expenses increased
$70 million or 4 percent in 2012 as compared to the prior year, driven
by higher volume-related rewards costs and co-brand expenses and
higher Card Member services expenses, partially offset by lower
marketing and promotion expenses.
3Refer to footnote 2 on page 19 relating to changes in foreign
exchange rates.
28