American Express 2013 Annual Report Download - page 80
Download and view the complete annual report
Please find page 80 of the 2013 American Express annual report below. You can navigate through the pages in the report by either clicking on the pages listed below, or by using the keyword search tool below to find specific information within the annual report.-
 1
1 -
2
-
3
-
4
-
5
-
6
-
7
-
8
-
9
-
10
-
11
-
12
-
13
-
14
-
15
-
16
-
17
-
18
-
19
-
20
-
21
-
22
-
23
-
24
-
25
-
26
-
27
-
28
-
29
-
30
-
31
-
32
-
33
-
34
-
35
-
36
-
37
-
38
-
39
-
40
-
41
-
42
-
43
-
44
-
45
-
46
-
47
-
48
-
49
-
50
-
51
-
52
-
53
-
54
-
55
-
56
-
57
-
58
-
59
-
60
-
61
-
62
-
63
-
64
-
65
-
66
-
67
-
68
-
69
-
 70
70 -
 71
71 -
 72
72 -
 73
73 -
 74
74 -
 75
75 -
 76
76 -
 77
77 -
 78
78 -
 79
79 -
 80
80 -
 81
81 -
 82
82 -
 83
83 -
 84
84 -
 85
85 -
 86
86 -
 87
87 -
 88
88 -
 89
89 -
 90
90 -
91
-
92
-
93
-
94
-
95
-
96
-
97
-
98
-
99
-
100
-
101
-
102
-
103
-
104
-
105
-
106
-
107
-
108
-
109
-
110
-
111
-
112
-
113
-
114
 |
 |

AMERICAN EXPRESS COMPANY
NOTES TO CONSOLIDATED FINANCIAL STATEMENTS
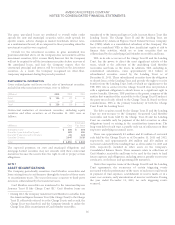
CHANGES IN CARD MEMBER LOANS RESERVE FOR LOSSES
The following table presents changes in the Card Member loans
reserve for losses for the years ended December 31:
(Millions) 2013 2012 2011
Balance, January 1 $ 1,471 $ 1,874 $ 3,646
Additions:
Provisions(a) 1,114 1,031 145
Other(b) 115 118 108
Total provision 1,229 1,149 253
Deductions:
Net write-offs
Principal(c) (1,141) (1,280) (1,720)
Interest and fees(c) (150) (157) (201)
Other(d) (148) (115) (104)
Balance, December 31 $ 1,261 $ 1,471 $ 1,874
(a) Provisions for principal (resulting from authorized transactions), interest and
fee reserves components.
(b) Provisions for unauthorized transactions.
(c) Consists of principal write-offs (resulting from authorized transactions), less
recoveries of $452 million, $493 million and $578 million, including net write-
offs from TDRs of $(1) million, $25 million and $29 million, for the years
ended December 31, 2013, 2012 and 2011, respectively. Recoveries of interest
and fees were de minimis.
(d) Includes net write-offs resulting from unauthorized transactions of $(130)
million, $(116) million and $(103) million for the years ended December 31,
2013, 2012 and 2011, respectively; foreign currency translation adjustments
of $(12) million, $7 million and $(2) million for the years ended December 31,
2013, 2012 and 2011, respectively; a reclassification of Card Member
bankruptcy reserves of $4 million from other liabilities to credit reserves in
2012 and other items of $(6) million, $(10) million and $1 million, for the years
ended December 31, 2013, 2012 and 2011, respectively.
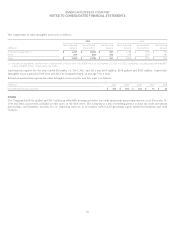
CARD MEMBER LOANS EVALUATED INDIVIDUALLY AND
COLLECTIVELY FOR IMPAIRMENT
The following table presents Card Member loans evaluated
individually and collectively for impairment and related reserves as of
December 31:
(Millions) 2013 2012 2011
Card Member loans evaluated
individually for impairment(a) $ 378 $ 633 $ 744
Related reserves(a) $ 84 $ 153 $ 176
Card Member loans evaluated
collectively for impairment(b) $ 66,860 $ 64,596 $ 61,877
Related reserves(b) $ 1,177 $ 1,318 $ 1,698
(a) Represents loans modified in a TDR and related reserves. Refer to the
Impaired Card Member Loans and Receivables discussion in Note 4 for
further information.
(b) Represents current loans and loans less than 90 days past due, loans over 90
days past due and accruing interest, and non-accrual loans and related
reserves. The reserves include the quantitative results of analytical models
that are specific to individual pools of loans and reserves for external
environmental qualitative factors that apply to loans in geographic markets
that are collectively evaluated for impairment and are not specific to any
individual pool of loans.
78