American Express 2013 Annual Report Download - page 35
Download and view the complete annual report
Please find page 35 of the 2013 American Express annual report below. You can navigate through the pages in the report by either clicking on the pages listed below, or by using the keyword search tool below to find specific information within the annual report.-
 1
1 -
2
-
3
-
4
-
5
-
6
-
7
-
8
-
9
-
10
-
11
-
12
-
13
-
14
-
15
-
16
-
17
-
18
-
19
-
20
-
21
-
22
-
23
-
24
-
 25
25 -
 26
26 -
 27
27 -
 28
28 -
 29
29 -
 30
30 -
 31
31 -
 32
32 -
 33
33 -
 34
34 -
 35
35 -
 36
36 -
 37
37 -
 38
38 -
 39
39 -
 40
40 -
 41
41 -
 42
42 -
 43
43 -
 44
44 -
 45
45 -
46
-
47
-
48
-
49
-
50
-
51
-
52
-
53
-
54
-
55
-
56
-
57
-
58
-
59
-
60
-
61
-
62
-
63
-
64
-
65
-
66
-
67
-
68
-
69
-
70
-
71
-
72
-
73
-
74
-
75
-
76
-
77
-
78
-
79
-
80
-
81
-
82
-
83
-
84
-
85
-
86
-
87
-
88
-
89
-
90
-
91
-
92
-
93
-
94
-
95
-
96
-
97
-
98
-
99
-
100
-
101
-
102
-
103
-
104
-
105
-
106
-
107
-
108
-
109
-
110
-
111
-
112
-
113
-
114
 |
 |

AMERICAN EXPRESS COMPANY
2013 FINANCIAL REVIEW
GLOBAL NETWORK & MERCHANT SERVICES SEGMENT
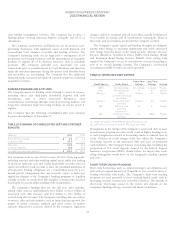
TABLE 15: GNMS SELECTED INCOME STATEMENT DATA
Years Ended December 31,
(Millions, except percentages) 2013 2012 2011
Change
2013 vs. 2012
Change
2012 vs. 2011
Revenues
Discount revenue, net card fees and other $ 5,229 $ 5,005 $ 4,713 $ 224 4% $ 292 6%
Interest income 32 23 5 9 39 18 #
Interest expense (252) (243) (224) (9) 4 (19) 8
Net interest income 284 266 229 18 7 37 16
Total revenues net of interest expense 5,513 5,271 4,942 242 5 329 7
Provisions for losses 69 74 75 (5) (7) (1) (1)
Total revenues net of interest expense after provisions for losses 5,444 5,197 4,867 247 5 330 7
Expenses
Marketing, promotion, rewards and Card Member services 704 744 755 (40) (5) (11) (1)
Salaries and employee benefits and other operating expenses 2,271 2,234 2,133 37 2 101 5
Total expenses 2,975 2,978 2,888 (3) — 90 3
Pretax segment income 2,469 2,219 1,979 250 11 240 12
Income tax provision 894 776 686 118 15 90 13
Segment income $ 1,575 $ 1,443 $ 1,293 $ 132 9% $ 150 12%
Effective tax rate 36.2% 35.0% 34.7%
# Denotes a variance greater than 100 percent.
GNMS operates a global payments network which processes and
settles proprietary and non-proprietary card transactions. GNMS
acquires merchants and provides point-of-sale products, multi-
channel marketing programs and capabilities, services and data,
leveraging the Company’s global closed-loop network. It provides
ATM services and enters into partnership agreements with third-party
card issuers and acquirers, licensing the American Express brand and
extending the reach of the global network.
TOTAL REVENUES NET OF INTEREST EXPENSE
Discount revenue, net card fees and other revenues increased $224
million or 4 percent in 2013 as compared to the prior year. The
increase primarily reflects higher merchant-related revenues, driven
by a 7 percent increase in global card billed business, as well as higher
GNS revenues.
The interest expense credit increased $9 million or 4 percent in
2013 as compared to the prior year, reflecting the Company’s internal
transfer pricing and funding rates, which results in a net benefit for
GNMS due to its merchant payables.
Total revenues net of interest expense increased $329 million or 7
percent in 2012 as compared to the prior year, primarily due to higher
discount revenue, net card fees and other revenues and higher net
interest income.
PROVISIONS FOR LOSSES
Provisions for losses decreased $5 million or 7 percent in 2013 as
compared to the prior year. Provisions for losses decreased $1 million
or 1 percent in 2012 as compared to the prior year.
EXPENSES
Marketing, promotion, rewards and Card Member services expenses
decreased $40 million or 5 percent in 2013 as compared to 2012 and
$11 million or 1 percent in 2012 compared to 2011. The decrease in
both years reflects lower marketing and promotion expenses.
Salaries and employee benefits and other operating expenses
increased $37 million or 2 percent in 2013 as compared to the prior
year, primarily reflecting increased other operating expenses related to
the proposed merchant litigation settlement, partially offset by
decreases in professional services and salary and employee benefits.
Salaries and employee benefits and other operating expenses increased
$101 million or 5 percent in 2012 as compared to the prior year,
primarily due to higher professional services costs and increases in
salary and employee benefits costs, partially offset by other operating
expenses.
33