American Express 2013 Annual Report Download - page 36
Download and view the complete annual report
Please find page 36 of the 2013 American Express annual report below. You can navigate through the pages in the report by either clicking on the pages listed below, or by using the keyword search tool below to find specific information within the annual report.-
 1
1 -
2
-
3
-
4
-
5
-
6
-
7
-
8
-
9
-
10
-
11
-
12
-
13
-
14
-
15
-
16
-
17
-
18
-
19
-
20
-
21
-
22
-
23
-
24
-
25
-
 26
26 -
 27
27 -
 28
28 -
 29
29 -
 30
30 -
 31
31 -
 32
32 -
 33
33 -
 34
34 -
 35
35 -
 36
36 -
 37
37 -
 38
38 -
 39
39 -
 40
40 -
 41
41 -
 42
42 -
 43
43 -
 44
44 -
 45
45 -
 46
46 -
47
-
48
-
49
-
50
-
51
-
52
-
53
-
54
-
55
-
56
-
57
-
58
-
59
-
60
-
61
-
62
-
63
-
64
-
65
-
66
-
67
-
68
-
69
-
70
-
71
-
72
-
73
-
74
-
75
-
76
-
77
-
78
-
79
-
80
-
81
-
82
-
83
-
84
-
85
-
86
-
87
-
88
-
89
-
90
-
91
-
92
-
93
-
94
-
95
-
96
-
97
-
98
-
99
-
100
-
101
-
102
-
103
-
104
-
105
-
106
-
107
-
108
-
109
-
110
-
111
-
112
-
113
-
114
 |
 |

AMERICAN EXPRESS COMPANY
2013 FINANCIAL REVIEW
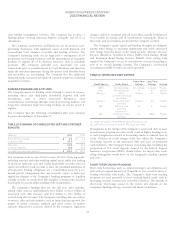
TABLE 16: GNMS SELECTED STATISTICAL INFORMATION
As of or for the Years Ended December 31,
(Millions, except percentages and where indicated) 2013 2012 2011
Change
2013 vs. 2012
Change
2012 vs. 2011
Global Worldwide Card billed business (billions) $ 952.4 $ 888.4 $ 822.2 7% 8%
Global Network & Merchant Services:
Total segment assets (billions) $ 17.1 $ 16.5 $ 17.8 4 (7)
Segment capital $ 1,952 $ 2,048 $ 2,037 (5) 1
Return on average segment capital(a) 76.8% 68.6% 66.3%
Return on average tangible segment capital(a) 84.9% 75.9% 74.3%
Global Network Services:
Card billed business (billions) $ 144.1 $ 128.8 $ 116.8 12 10
Total cards-in-force 40.7 37.6 34.2 8% 10%
(a) Return on average segment capital is calculated by dividing (i) one-year period segment income ($1.6 billion, $1.4 billion and $1.3 billion for 2013, 2012 and 2011,
respectively) by (ii) one-year average segment capital ($2.1 billion for both 2013 and 2012 and $1.9 billion for 2011). Return on average tangible segment capital, a
non-GAAP measure, is computed in the same manner as return on average segment capital except the computation of average tangible segment capital, a non-GAAP
measure, excludes from average segment capital average goodwill and other intangibles of $195 million, $203 million and $209 million as of December 31, 2013, 2012
and 2011, respectively. The Company believes return on average tangible segment capital is a useful measure of the profitability of its business.
CORPORATE & OTHER
Corporate functions and auxiliary businesses, including the
Company’s EGG (including Global Payment Options) and other
Company operations, are included in Corporate & Other.
Corporate & Other had net after-tax expense of $900 million, $831
million and $535 million in 2013, 2012 and 2011, respectively. The
increase in net after-tax expense for 2013 was primarily a result of
favorable effects in 2012 of revised estimates of the liability for
uncashed Travelers Cheques in certain international countries, as well
as higher tax expenses in the current year. The 2013 increase was
partially offset by the impact of restructuring costs in 2012.
The increase in net after-tax expense in 2012 was primarily a result
of the loss of after-tax income related to the MasterCard and Visa
settlements of $186 million and $172 million, respectively which
ended in the fourth quarter of 2011, as well as an increase in
restructuring costs. The 2012 increase was partially offset by higher
gains on sales of investment securities and the aforementioned
favorable effects of revised estimates of the liability for uncashed
international Travelers Cheques.
Results for all periods disclosed also included net interest expense
related to maintaining the liquidity pool discussed in “Consolidated
Capital Resources and Liquidity — Liquidity Management”, as well as
interest expense related to other corporate indebtedness.
34