American Express 2013 Annual Report Download - page 81
Download and view the complete annual report
Please find page 81 of the 2013 American Express annual report below. You can navigate through the pages in the report by either clicking on the pages listed below, or by using the keyword search tool below to find specific information within the annual report.-
 1
1 -
2
-
3
-
4
-
5
-
6
-
7
-
8
-
9
-
10
-
11
-
12
-
13
-
14
-
15
-
16
-
17
-
18
-
19
-
20
-
21
-
22
-
23
-
24
-
25
-
26
-
27
-
28
-
29
-
30
-
31
-
32
-
33
-
34
-
35
-
36
-
37
-
38
-
39
-
40
-
41
-
42
-
43
-
44
-
45
-
46
-
47
-
48
-
49
-
50
-
51
-
52
-
53
-
54
-
55
-
56
-
57
-
58
-
59
-
60
-
61
-
62
-
63
-
64
-
65
-
66
-
67
-
68
-
69
-
70
-
 71
71 -
 72
72 -
 73
73 -
 74
74 -
 75
75 -
 76
76 -
 77
77 -
 78
78 -
 79
79 -
 80
80 -
 81
81 -
 82
82 -
 83
83 -
 84
84 -
 85
85 -
 86
86 -
 87
87 -
 88
88 -
 89
89 -
 90
90 -
 91
91 -
92
-
93
-
94
-
95
-
96
-
97
-
98
-
99
-
100
-
101
-
102
-
103
-
104
-
105
-
106
-
107
-
108
-
109
-
110
-
111
-
112
-
113
-
114
 |
 |

AMERICAN EXPRESS COMPANY
NOTES TO CONSOLIDATED FINANCIAL STATEMENTS
NOTE 6
INVESTMENT SECURITIES
Investment securities include debt and equity securities classified as
available for sale. The Company’s investment securities, principally
debt securities, are carried at fair value on the Consolidated Balance
Sheets with unrealized gains (losses) recorded in AOCI, net of income
taxes. Realized gains and losses are recognized in results of operations
upon disposition of the securities using the specific identification
method on a trade date basis. Refer to Note 3 for a description of the
Company’s methodology for determining the fair value of investment
securities.
The following is a summary of investment securities as of December 31:
2013 2012
Description of Securities (Millions) Cost
Gross
Unrealized
Gains
Gross
Unrealized
Losses
Estimated
Fair
Value Cost
Gross
Unrealized
Gains
Gross
Unrealized
Losses
Estimated
Fair
Value
State and municipal obligations $ 4,060 $ 54 $ (79) $ 4,035 $ 4,280 $ 199 $ (5) $ 4,474
U.S. Government agency obligations 3—— 3 3—— 3
U.S. Government treasury obligations 318 3 (1) 320 330 8 — 338
Corporate debt securities 43 3 — 46 73 6 — 79
Mortgage-backed securities(a) 160 5 (1) 164 210 14 — 224
Equity securities(b) 29 95 — 124 64 232 — 296
Foreign government bonds and obligations 272 5 (1) 276 134 15 — 149
Other(c) 50 — (2) 48 51 — — 51
Total $ 4,935 $ 165 $ (84) $ 5,016 $ 5,145 $ 474 $ (5) $ 5,614
(a) Represents mortgage-backed securities guaranteed by Fannie Mae, Freddie Mac or Ginnie Mae.
(b) Primarily represents the Company’s investment in ICBC.
(c) Other comprises investments in various mutual funds.
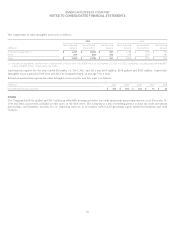
The following table provides information about the Company’s investment securities with gross unrealized losses and the length of time that
individual securities have been in a continuous unrealized loss position as of December 31:
2013 2012
Less than 12 months 12 months or more Less than 12 months 12 months or more
Description of Securities (Millions)
Estimated
Fair Value
Gross
Unrealized
Losses
Estimated
Fair Value
Gross
Unrealized
Losses
Estimated
Fair Value
Gross
Unrealized
Losses
Estimated
Fair Value
Gross
Unrealized
Losses
State and municipal obligations $ 1,320 $ (63) $ 106 $ (16) $ 100 $ (1) $ 73 $ (4)
Foreign government bonds and obligations 208 (1) — — ————
U.S. Government treasury obligations 166 (1) — — ————
Mortgage-backed securities 35 (1) — — ————
Other 30 (1) 17 (1) ————
Total $ 1,759 $ (67) $ 123 $ (17) $ 100 $ (1) $ 73 $ (4)
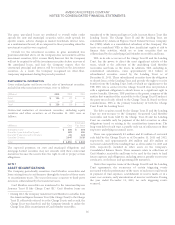
The following table summarizes the gross unrealized losses due to temporary impairments by ratio of fair value to amortized cost as of
December 31:
Less than 12 months 12 months or more Total
Ratio of Fair Value to
Amortized Cost (Dollars in millions)
Number of
Securities
Estimated
Fair Value
Gross
Unrealized
Losses
Number of
Securities
Estimated
Fair Value
Gross
Unrealized
Losses
Number of
Securities
Estimated
Fair Value
Gross
Unrealized
Losses
2013:
90% – 100% 228 $ 1,665 $ (53) 6 $ 24 $ (2) 234 $ 1,689 $ (55)
Less than 90% 13 94 (14) 5 99 (15) 18 193 (29)
Total as of December 31, 2013 241 $ 1,759 $ (67) 11 $ 123 $ (17) 252 $ 1,882 $ (84)
2012:
90% – 100% 46 $ 100 $ (1) 4 $ 73 $ (4) 50 $ 173 $ (5)
Total as of December 31, 2012 46 $ 100 $ (1) 4 $ 73 $ (4) 50 $ 173 $ (5)
79