American Express 2013 Annual Report Download - page 83
Download and view the complete annual report
Please find page 83 of the 2013 American Express annual report below. You can navigate through the pages in the report by either clicking on the pages listed below, or by using the keyword search tool below to find specific information within the annual report.-
 1
1 -
2
-
3
-
4
-
5
-
6
-
7
-
8
-
9
-
10
-
11
-
12
-
13
-
14
-
15
-
16
-
17
-
18
-
19
-
20
-
21
-
22
-
23
-
24
-
25
-
26
-
27
-
28
-
29
-
30
-
31
-
32
-
33
-
34
-
35
-
36
-
37
-
38
-
39
-
40
-
41
-
42
-
43
-
44
-
45
-
46
-
47
-
48
-
49
-
50
-
51
-
52
-
53
-
54
-
55
-
56
-
57
-
58
-
59
-
60
-
61
-
62
-
63
-
64
-
65
-
66
-
67
-
68
-
69
-
70
-
71
-
72
-
 73
73 -
 74
74 -
 75
75 -
 76
76 -
 77
77 -
 78
78 -
 79
79 -
 80
80 -
 81
81 -
 82
82 -
 83
83 -
 84
84 -
 85
85 -
 86
86 -
 87
87 -
 88
88 -
 89
89 -
 90
90 -
 91
91 -
 92
92 -
 93
93 -
94
-
95
-
96
-
97
-
98
-
99
-
100
-
101
-
102
-
103
-
104
-
105
-
106
-
107
-
108
-
109
-
110
-
111
-
112
-
113
-
114
 |
 |

AMERICAN EXPRESS COMPANY
NOTES TO CONSOLIDATED FINANCIAL STATEMENTS
NOTE 8
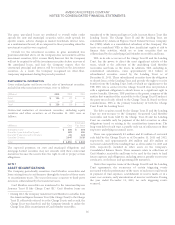
OTHER ASSETS
The following is a summary of other assets as of December 31:
(Millions) 2013 2012
Goodwill $ 3,198 $ 3,181
Deferred tax assets, net(a) 2,443 2,458
Prepaid expenses(b) 1,998 1,960
Other intangible assets, at amortized cost 817 993
Restricted cash(c) 486 568
Derivative assets(a) 329 593
Other 1,957 1,665
Total $ 11,228 $ 11,418
(a) Refer to Notes 17 and 12 for a discussion of deferred tax assets, net, and
derivative assets, respectively, as of December 31, 2013 and 2012. Derivative
assets reflect the impact of master netting agreements.
(b) Includes prepaid miles and reward points acquired primarily from airline
partners of approximately $1.5 billion and $1.4 billion, as of December 31,
2013 and 2012, respectively, including approximately $0.9 billion and $1.1
billion, respectively, from Delta.
(c) Includes restricted cash of approximately $58 million and $76 million,
respectively, as of December 31, 2013 and 2012, which is primarily held for
coupon and certain asset-backed securitization maturities.
GOODWILL
Goodwill represents the excess of acquisition cost of an acquired
company over the fair value of assets acquired and liabilities assumed.
The Company assigns goodwill to its reporting units for the purpose
of impairment testing. A reporting unit is defined as an operating
segment, or a business that is one level below an operating segment for
which discrete financial information is regularly reviewed by the
operating segment manager. The Company evaluates goodwill for
impairment annually as of June 30 and between annual tests if events
occur or circumstances change that would more likely than not reduce
the fair value of the reporting unit below its carrying value. The
goodwill impairment test utilizes a two-step approach. The first step in
the impairment test identifies whether there is potential impairment
by comparing the fair value of a reporting unit to the carrying amount,
including goodwill. If the fair value of a reporting unit is less than its
carrying amount, the second step of the impairment test is required to
measure the amount of any impairment loss. As of December 31, 2013
and 2012, goodwill was not impaired and there were no accumulated
impairment losses.
Goodwill impairment testing involves management judgment,
requiring an assessment of whether the carrying value of the reporting
unit can be supported by its fair value using widely accepted valuation
techniques. The Company uses a combination of the income approach
(discounted cash flows) and market approach (market multiples).
When preparing discounted cash flow models under the income
approach, the Company uses internal forecasts to estimate future cash
flows expected to be generated by the reporting units. Actual results
may differ from forecasted results. The Company calculates discount
rates based on the expected cost of equity financing, estimated using a
capital asset pricing model, to discount future cash flows for each
reporting unit. The Company believes the discount rates used
appropriately reflect the risks and uncertainties in the financial
markets generally and specifically in the Company’s internally
developed forecasts. When using market multiples under the market
approach, the Company applies comparable publically traded
companies’ multiples (e.g. earnings, revenues) to its reporting units’
actual results.
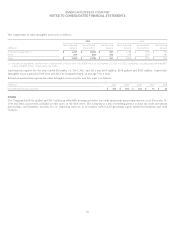
The changes in the carrying amount of goodwill reported in the Company’s reportable operating segments and Corporate & Other were as
follows:
(Millions) USCS ICS GCS GNMS
Corporate &
Other Total
Balance as of January 1, 2012 $ 175 $ 1,023 $ 1,543 $ 160 $ 271 $ 3,172
Acquisitions — 1——— 1
Dispositions — (2) (1) — — (3)
Other, including foreign currency translation — 9 2 — — 11
Balance as of December 31, 2012 $ 175 $ 1,031 $ 1,544 $ 160 $ 271 $ 3,181
Acquisitions ——————
Dispositions ——————
Other, including foreign currency translation (1) 21 (1) —(2) 17
Balance as of December 31, 2013 $ 174 $ 1,052 $ 1,543 $ 160 $ 269 $ 3,198
OTHER INTANGIBLE ASSETS
Intangible assets, primarily customer relationships, are amortized over
their estimated useful lives of 1 to 22 years on a straight-line basis. The
Company reviews intangible assets for impairment quarterly and
whenever events and circumstances indicate their carrying amounts
may not be recoverable. In addition, on an annual basis, the Company
performs an impairment evaluation of all intangible assets by assessing
the recoverability of the asset values based on the cash flows generated
by the relevant assets or asset groups. An impairment is recognized if
the carrying amount is not recoverable and exceeds the asset’s fair
value.
81