American Express 2013 Annual Report Download - page 79
Download and view the complete annual report
Please find page 79 of the 2013 American Express annual report below. You can navigate through the pages in the report by either clicking on the pages listed below, or by using the keyword search tool below to find specific information within the annual report.-
 1
1 -
2
-
3
-
4
-
5
-
6
-
7
-
8
-
9
-
10
-
11
-
12
-
13
-
14
-
15
-
16
-
17
-
18
-
19
-
20
-
21
-
22
-
23
-
24
-
25
-
26
-
27
-
28
-
29
-
30
-
31
-
32
-
33
-
34
-
35
-
36
-
37
-
38
-
39
-
40
-
41
-
42
-
43
-
44
-
45
-
46
-
47
-
48
-
49
-
50
-
51
-
52
-
53
-
54
-
55
-
56
-
57
-
58
-
59
-
60
-
61
-
62
-
63
-
64
-
65
-
66
-
67
-
68
-
 69
69 -
 70
70 -
 71
71 -
 72
72 -
 73
73 -
 74
74 -
 75
75 -
 76
76 -
 77
77 -
 78
78 -
 79
79 -
 80
80 -
 81
81 -
 82
82 -
 83
83 -
 84
84 -
 85
85 -
 86
86 -
 87
87 -
 88
88 -
 89
89 -
90
-
91
-
92
-
93
-
94
-
95
-
96
-
97
-
98
-
99
-
100
-
101
-
102
-
103
-
104
-
105
-
106
-
107
-
108
-
109
-
110
-
111
-
112
-
113
-
114
 |
 |

AMERICAN EXPRESS COMPANY
NOTES TO CONSOLIDATED FINANCIAL STATEMENTS
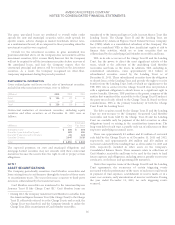
NOTE 5
RESERVES FOR LOSSES
Reserves for losses relating to Card Member loans and receivables
represent management’s best estimate of the probable inherent losses
in the Company’s outstanding portfolio of loans and receivables, as of
the balance sheet date. Management’s evaluation process requires
certain estimates and judgments.
Reserves for losses are primarily based upon statistical and
analytical models that analyze portfolio performance and reflect
management’s judgment regarding the quantitative components of the
reserve. The models take into account several factors, including
delinquency based loss migration rates, loss emergence periods and
average losses and recoveries over an appropriate historical period.
Management considers whether to adjust the models for specific
qualitative factors such as increased risk in certain portfolios, impact
of risk management initiatives on portfolio performance and
concentration of credit risk based on factors such as vintage, industry
or geographic regions. In addition, management may increase or
decrease the reserves for losses on Card Member loans for other
external environmental qualitative factors, including various
indicators related to employment, spend, sentiment, housing and
credit, as well as the legal and regulatory environment. Generally, due
to the short-term nature of Card Member receivables, the impact of
additional external qualitative factors on the probable losses inherent
within the Card Member receivables portfolio is not significant. As
part of this evaluation process, management also considers various
reserve coverage metrics, such as reserves as a percentage of past due
amounts, reserves as a percentage of Card Member receivables or
loans and net write-off coverage.
Card Member loans and receivables balances are written off when
management considers amounts to be uncollectible, which is generally
determined by the number of days past due and is typically no later
than 180 days past due. Card Member loans and receivables in
bankruptcy or owed by deceased individuals are generally written off
upon notification, and recoveries are recognized as they are collected.
CHANGES IN CARD MEMBER RECEIVABLES RESERVE FOR LOSSES
The following table presents changes in the Card Member receivables
reserve for losses for the years ended December 31:
(Millions) 2013 2012 2011
Balance, January 1 $ 428 $ 438 $ 386
Additions:
Provisions(a) 647 601 603
Other(b) 142 141 167
Total provision 789 742 770
Deductions:
Net write-offs(c) (669) (640) (560)
Other(d) (162) (112) (158)
Balance, December 31 $ 386 $ 428 $ 438
(a) Provisions for principal (resulting from authorized transactions) and fee
reserve components.
(b) Provisions for unauthorized transactions.
(c) Consists of principal (resulting from authorized transactions) and fee
components, less recoveries of $402 million, $383 million and $349 million,
including net write-offs from TDRs of $12 million, $87 million and $82 million,
for the years ended 2013, 2012 and 2011, respectively.
(d) Includes net write-offs resulting from unauthorized transactions of $(160)
million, $(141) million and $(161) million for the years ended December 31,
2013, 2012 and 2011, respectively; foreign currency translation adjustments
of $(4) million, $2 million and $(2) million for the years ended December 31,
2013, 2012 and 2011, respectively; a reclassification of Card Member
bankruptcy reserves of $18 million from other liabilities to credit reserves in
2012 and other items of $2 million, $9 million and $5 million for the years
ended December 31, 2013, 2012 and 2011, respectively.
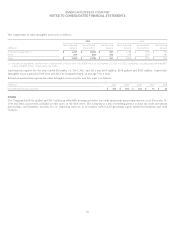
CARD MEMBER RECEIVABLES EVALUATED INDIVIDUALLY AND
COLLECTIVELY FOR IMPAIRMENT
The following table presents Card Member receivables evaluated
individually and collectively for impairment and related reserves as of
December 31:
(Millions) 2013 2012 2011
Card Member receivables evaluated
individually for impairment(a) $ 50 $ 117 $ 174
Related reserves(a) $ 38 $ 91 $ 118
Card Member receivables evaluated
collectively for impairment $ 44,113 $ 42,649 $ 40,716
Related reserves $ 348 $ 337 $ 320
(a) Represents receivables modified in a TDR and related reserves. Refer to the
Impaired Card Member Loans and Receivables discussion in Note 4 for
further information.
77