American Express 2013 Annual Report Download - page 33
Download and view the complete annual report
Please find page 33 of the 2013 American Express annual report below. You can navigate through the pages in the report by either clicking on the pages listed below, or by using the keyword search tool below to find specific information within the annual report.-
 1
1 -
2
-
3
-
4
-
5
-
6
-
7
-
8
-
9
-
10
-
11
-
12
-
13
-
14
-
15
-
16
-
17
-
18
-
19
-
20
-
21
-
22
-
 23
23 -
 24
24 -
 25
25 -
 26
26 -
 27
27 -
 28
28 -
 29
29 -
 30
30 -
 31
31 -
 32
32 -
 33
33 -
 34
34 -
 35
35 -
 36
36 -
 37
37 -
 38
38 -
 39
39 -
 40
40 -
 41
41 -
 42
42 -
 43
43 -
44
-
45
-
46
-
47
-
48
-
49
-
50
-
51
-
52
-
53
-
54
-
55
-
56
-
57
-
58
-
59
-
60
-
61
-
62
-
63
-
64
-
65
-
66
-
67
-
68
-
69
-
70
-
71
-
72
-
73
-
74
-
75
-
76
-
77
-
78
-
79
-
80
-
81
-
82
-
83
-
84
-
85
-
86
-
87
-
88
-
89
-
90
-
91
-
92
-
93
-
94
-
95
-
96
-
97
-
98
-
99
-
100
-
101
-
102
-
103
-
104
-
105
-
106
-
107
-
108
-
109
-
110
-
111
-
112
-
113
-
114
 |
 |

AMERICAN EXPRESS COMPANY
2013 FINANCIAL REVIEW
GLOBAL COMMERCIAL SERVICES SEGMENT
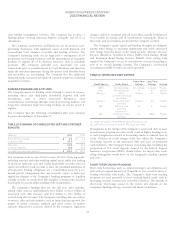
TABLE 13: GCS SELECTED INCOME STATEMENT DATA
Years Ended December 31,
(Millions, except percentages) 2013 2012 2011
Change
2013 vs. 2012
Change
2012 vs. 2011
Revenues
Discount revenue, net card fees and other $ 5,085 $ 4,995 $ 4,880 $ 90 2% $ 115 2%
Interest income 13 11 9 2 18 2 22
Interest expense 245 257 264 (12) (5) (7) (3)
Net interest expense (232) (246) (255) (14) (6) (9) (4)
Total revenues net of interest expense 4,853 4,749 4,625 104 2 124 3
Provisions for losses 159 136 76 23 17 60 79
Total revenues net of interest expense after provisions for losses 4,694 4,613 4,549 81 2 64 1
Expenses
Marketing, promotion, rewards and Card Member services 604 579 547 25 4 32 6
Salaries and employee benefits and other operating expenses 2,846 3,074 2,927 (228) (7) 147 5
Total expenses 3,450 3,653 3,474 (203) (6) 179 5
Pretax segment income 1,244 960 1,075 284 30 (115) (11)
Income tax provision 384 316 337 68 22 (21) (6)
Segment income $ 860 $ 644 $ 738 $ 216 34% $ (94) (13)%
Effective tax rate 30.9% 32.9% 31.3%
GCS offers global corporate payment and travel-related products and
services to large and mid-sized companies.
TOTAL REVENUES NET OF INTEREST EXPENSE
Discount revenue, net card fees, and other revenues increased $90
million or 2 percent in 2013 as compared to the prior year, primarily
due to higher discount revenue resulting from an increased level of
Card Member spending and higher other commissions and fees. Billed
business increased 5 percent in 2013 as compared to the prior year,
primarily driven by a 5 percent increase in average spending per
proprietary basic card. Billed business volume increased 8 percent
within the U.S. and 2 percent outside the U.S.
Net interest expense decreased $14 million or 6 percent in 2013 as
compared to the prior year, primarily driven by a lower cost of funds,
partially offset by increased funding requirements due to higher
average Card Member receivable balances. Excluding the impact of
changes in foreign exchange rates, net interest expense decreased 3
percent for 2013 as compared to the prior year.5
Total revenues net of interest expense increased $124 million or 3
percent in 2012 as compared to the prior year, primarily due to higher
discount revenue, net card fees, and other revenues.
PROVISIONS FOR LOSSES
Provisions for losses increased $23 million or 17 percent in 2013 as
compared to the prior year, primarily reflecting higher average Card
Member receivables resulting in higher net write-offs, partially offset
by a lower reserve build compared to the prior year. Provisions for
losses increased $60 million or 79 percent in 2012 as compared to the
prior year, reflecting a change in estimate for certain credit reserves
that resulted in higher reserve releases in 2011. Refer to Table 14 for
the charge card net loss ratio as a percentage of charge volume.
EXPENSES
Marketing, promotion, rewards and Card Member services expenses
increased $25 million or 4 percent in 2013 as compared to the prior
year, primarily reflecting higher rewards costs related to higher
volumes and an enhancement in the International Membership
Rewards URR estimation process. Marketing, promotion, rewards and
Card Member services expenses increased $32 million or 6 percent in
2012 as compared to the prior year, primarily due to a $25 million
charge related to a change in the U.S. Membership Rewards URR
estimation process.
Salaries and employee benefits and other operating expenses
decreased $228 million or 7 percent in 2013 as compared to the prior
year, primarily due to higher restructuring costs in 2012, as well as
lower payroll and benefit costs in 2013. Salaries and employee benefits
and other operating expenses increased $147 million or 5 percent in
2012 as compared to the prior year, primarily driven by higher
restructuring charges and other operating expenses.
INCOME TAXES
The effective tax rate for 2013 reflects the reversal of a valuation
allowance related to deferred tax assets associated with certain of the
Company’s non-U.S. business travel operations, as well as the
allocated share of tax benefits related to the resolution of certain prior
years’ tax items. Based on management’s intent to reorganize its
business travel operations through the creation of a joint venture, it is
more likely than not that future taxable income will be sufficient to
support the realization of the benefit of the associated non-US
deferred tax assets.
5Refer to footnote 2 on page 19, relating to changes in foreign
exchange rates.
31