American Express 2013 Annual Report Download - page 72
Download and view the complete annual report
Please find page 72 of the 2013 American Express annual report below. You can navigate through the pages in the report by either clicking on the pages listed below, or by using the keyword search tool below to find specific information within the annual report.-
 1
1 -
2
-
3
-
4
-
5
-
6
-
7
-
8
-
9
-
10
-
11
-
12
-
13
-
14
-
15
-
16
-
17
-
18
-
19
-
20
-
21
-
22
-
23
-
24
-
25
-
26
-
27
-
28
-
29
-
30
-
31
-
32
-
33
-
34
-
35
-
36
-
37
-
38
-
39
-
40
-
41
-
42
-
43
-
44
-
45
-
46
-
47
-
48
-
49
-
50
-
51
-
52
-
53
-
54
-
55
-
56
-
57
-
58
-
59
-
60
-
61
-
 62
62 -
 63
63 -
 64
64 -
 65
65 -
 66
66 -
 67
67 -
 68
68 -
 69
69 -
 70
70 -
 71
71 -
 72
72 -
 73
73 -
 74
74 -
 75
75 -
 76
76 -
 77
77 -
 78
78 -
 79
79 -
 80
80 -
 81
81 -
 82
82 -
83
-
84
-
85
-
86
-
87
-
88
-
89
-
90
-
91
-
92
-
93
-
94
-
95
-
96
-
97
-
98
-
99
-
100
-
101
-
102
-
103
-
104
-
105
-
106
-
107
-
108
-
109
-
110
-
111
-
112
-
113
-
114
 |
 |

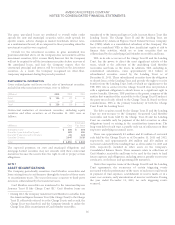
AMERICAN EXPRESS COMPANY
NOTES TO CONSOLIDATED FINANCIAL STATEMENTS
Credit valuation adjustments are necessary when the market
parameters, such as a benchmark curve, used to value derivatives are
not indicative of the credit quality of the Company or its
counterparties. The Company considers the counterparty credit risk
by applying an observable forecasted default rate to the current
exposure. Refer to Note 12 for additional fair value information.
FINANCIAL ASSETS AND FINANCIAL LIABILITIES CARRIED AT OTHER THAN FAIR VALUE
The following table discloses the estimated fair value for the Company’s financial assets and financial liabilities that are not required to be carried
at fair value on a recurring basis, as of December 31, 2013 and 2012:
2013 (Billions)
Carrying Corresponding Fair Value Amount
Value Total Level 1 Level 2 Level 3
Financial Assets:
Financial assets for which carrying values equal or approximate fair value
Cash and cash equivalents $ 19 $ 19 $ 17 $ 2(a) $—
Other financial assets(b) 48 48 — 48 —
Financial assets carried at other than fair value
Loans, net 67 67(c) — — 67
Financial Liabilities:
Financial liabilities for which carrying values equal or approximate fair value 60 60 — 60 —
Financial liabilities carried at other than fair value
Certificates of deposit(d) 7 8— 8—
Long-term debt $ 55 $ 58(c) $—$58$—
2012 (Billions)
Carrying Corresponding Fair Value Amount
Value Total Level 1 Level 2 Level 3
Financial Assets:
Financial assets for which carrying values equal or approximate fair value
Cash and cash equivalents $ 22 $ 22 $ 21 $ 1(a) $—
Other financial assets(b) 47 47 — 47 —
Financial assets carried at other than fair value
Loans, net 64 65(c) — — 65
Financial Liabilities:
Financial liabilities for which carrying values equal or approximate fair value 55 55 — 55 —
Financial liabilities carried at other than fair value
Certificates of deposit(d) 10 10 — 10 —
Long-term debt $59$62
(c) $—$62$—
(a) Reflects time deposits.
(b) Includes accounts receivable (including fair values of Card Member receivables of $7.3 billion and $8.0 billion held by consolidated VIEs as of December 31, 2013 and
2012, respectively), restricted cash and other miscellaneous assets.
(c) Includes fair values of loans of $31.0 billion and $32.4 billion, and long-term debt of $18.8 billion and $19.5 billion, held by consolidated VIEs as of December 31, 2013
and 2012, respectively.
(d) Presented as a component of customer deposits on the Consolidated Balance Sheets.
70