American Express 2013 Annual Report Download - page 34
Download and view the complete annual report
Please find page 34 of the 2013 American Express annual report below. You can navigate through the pages in the report by either clicking on the pages listed below, or by using the keyword search tool below to find specific information within the annual report.-
 1
1 -
2
-
3
-
4
-
5
-
6
-
7
-
8
-
9
-
10
-
11
-
12
-
13
-
14
-
15
-
16
-
17
-
18
-
19
-
20
-
21
-
22
-
23
-
 24
24 -
 25
25 -
 26
26 -
 27
27 -
 28
28 -
 29
29 -
 30
30 -
 31
31 -
 32
32 -
 33
33 -
 34
34 -
 35
35 -
 36
36 -
 37
37 -
 38
38 -
 39
39 -
 40
40 -
 41
41 -
 42
42 -
 43
43 -
 44
44 -
45
-
46
-
47
-
48
-
49
-
50
-
51
-
52
-
53
-
54
-
55
-
56
-
57
-
58
-
59
-
60
-
61
-
62
-
63
-
64
-
65
-
66
-
67
-
68
-
69
-
70
-
71
-
72
-
73
-
74
-
75
-
76
-
77
-
78
-
79
-
80
-
81
-
82
-
83
-
84
-
85
-
86
-
87
-
88
-
89
-
90
-
91
-
92
-
93
-
94
-
95
-
96
-
97
-
98
-
99
-
100
-
101
-
102
-
103
-
104
-
105
-
106
-
107
-
108
-
109
-
110
-
111
-
112
-
113
-
114
 |
 |

AMERICAN EXPRESS COMPANY
2013 FINANCIAL REVIEW
The effective tax rate for 2012 and 2011 reflects the allocated share
of tax benefits related to the realization of certain foreign tax credits.
The effective tax rate for 2012 also reflects the impact of a valuation
allowance primarily related to restructuring charges associated with
certain non-U.S. travel operations.
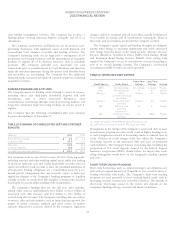
TABLE 14: GCS SELECTED STATISTICAL INFORMATION
As of or for the Years Ended December 31,
(Millions, except percentages and where indicated) 2013 2012 2011
Change
2013 vs. 2012
Change
2012 vs. 2011
Card billed business (billions) $ 175.4 $ 166.4 $ 154.2 5% 8%
Total cards-in-force 7.1 7.0 7.0 1 —
Basic cards-in-force 7.1 7.0 7.0 1 —
Average basic Card Member spending (dollars)*$ 24,924 $ 23,737 $ 21,898 5 8
Global Corporate Travel:
Travel sales $ 18,869 $ 18,894 $ 19,618 — (4)
Travel commissions and fees/sales 8.1% 8.1% 8.0%
Total segment assets (billions) $ 19.2 $ 18.9 $ 18.8 2 1
Segment capital $ 3,688 $ 3,625 $ 3,564 2 2
Return on average segment capital(a) 23.6% 17.6% 20.4%
Return on average tangible segment capital(a) 45.8% 35.1% 42.1%
Card Member receivables:
Total receivables (billions) $ 14.4 $ 13.7 $ 12.8 5% 7%
90 days past billing as a % of total 0.9% 0.8% 0.8%
Netlossratio(asa%ofchargevolume) 0.08% 0.06% 0.06%
* Proprietary cards only.
(a) Return on average segment capital is calculated by dividing (i) one-year period segment income ($860 million, $644 million and $738 million for 2013, 2012 and 2011,
respectively) by (ii) one-year average segment capital ($3.6 billion for each of 2013, 2012 and 2011). Return on average tangible segment capital, a non-GAAP
measure, is computed in the same manner as return on average segment capital except the computation of average tangible segment capital, a non-GAAP measure,
excludes from average segment capital average goodwill and other intangibles of $1.8 billion at both December 31, 2013 and 2012 and $1.9 billion at December 31,
2011. The Company believes return on average tangible segment capital is a useful measure of the profitability of its business.
32