Apple 2007 Annual Report Download - page 38
Download and view the complete annual report
Please find page 38 of the 2007 Apple annual report below. You can navigate through the pages in the report by either clicking on the pages listed below, or by using the keyword search tool below to find specific information within the annual report.-
 1
1 -
2
-
3
-
4
-
5
-
6
-
7
-
8
-
9
-
10
-
11
-
12
-
13
-
14
-
15
-
16
-
17
-
18
-
19
-
20
-
21
-
22
-
23
-
24
-
25
-
26
-
27
-
 28
28 -
 29
29 -
 30
30 -
 31
31 -
 32
32 -
 33
33 -
 34
34 -
 35
35 -
 36
36 -
 37
37 -
 38
38 -
 39
39 -
 40
40 -
 41
41 -
 42
42 -
 43
43 -
 44
44 -
 45
45 -
 46
46 -
 47
47 -
 48
48 -
49
-
50
-
51
-
52
-
53
-
54
-
55
-
56
-
57
-
58
-
59
-
60
-
61
-
62
-
63
-
64
-
65
-
66
-
67
-
68
-
69
-
70
-
71
-
72
-
73
-
74
-
75
-
76
-
77
-
78
-
79
-
80
-
81
-
82
-
83
-
84
-
85
-
86
-
87
-
88
-
89
-
90
-
91
-
92
-
93
-
94
-
95
-
96
-
97
-
98
-
99
-
100
-
101
-
102
-
103
-
104
-
105
-
106
-
107
-
108
-
109
-
110
-
111
-
112
-
113
-
114
-
115
-
116
-
117
-
118
-
119
-
120
-
121
-
122
-
123
-
124
-
125
-
126
-
127
-
128
-
129
-
130
-
131
-
132
-
133
-
134
-
135
-
136
-
137
-
138
-
139
-
140
-
141
-
142
-
143
-
144
-
145
-
146
-
147
-
148
-
149
-
150
-
151
-
152
-
153
-
154
-
155
-
156
-
157
-
158
-
159
-
160
-
161
-
162
-
163
-
164
-
165
-
166
-
167
-
168
 |
 |
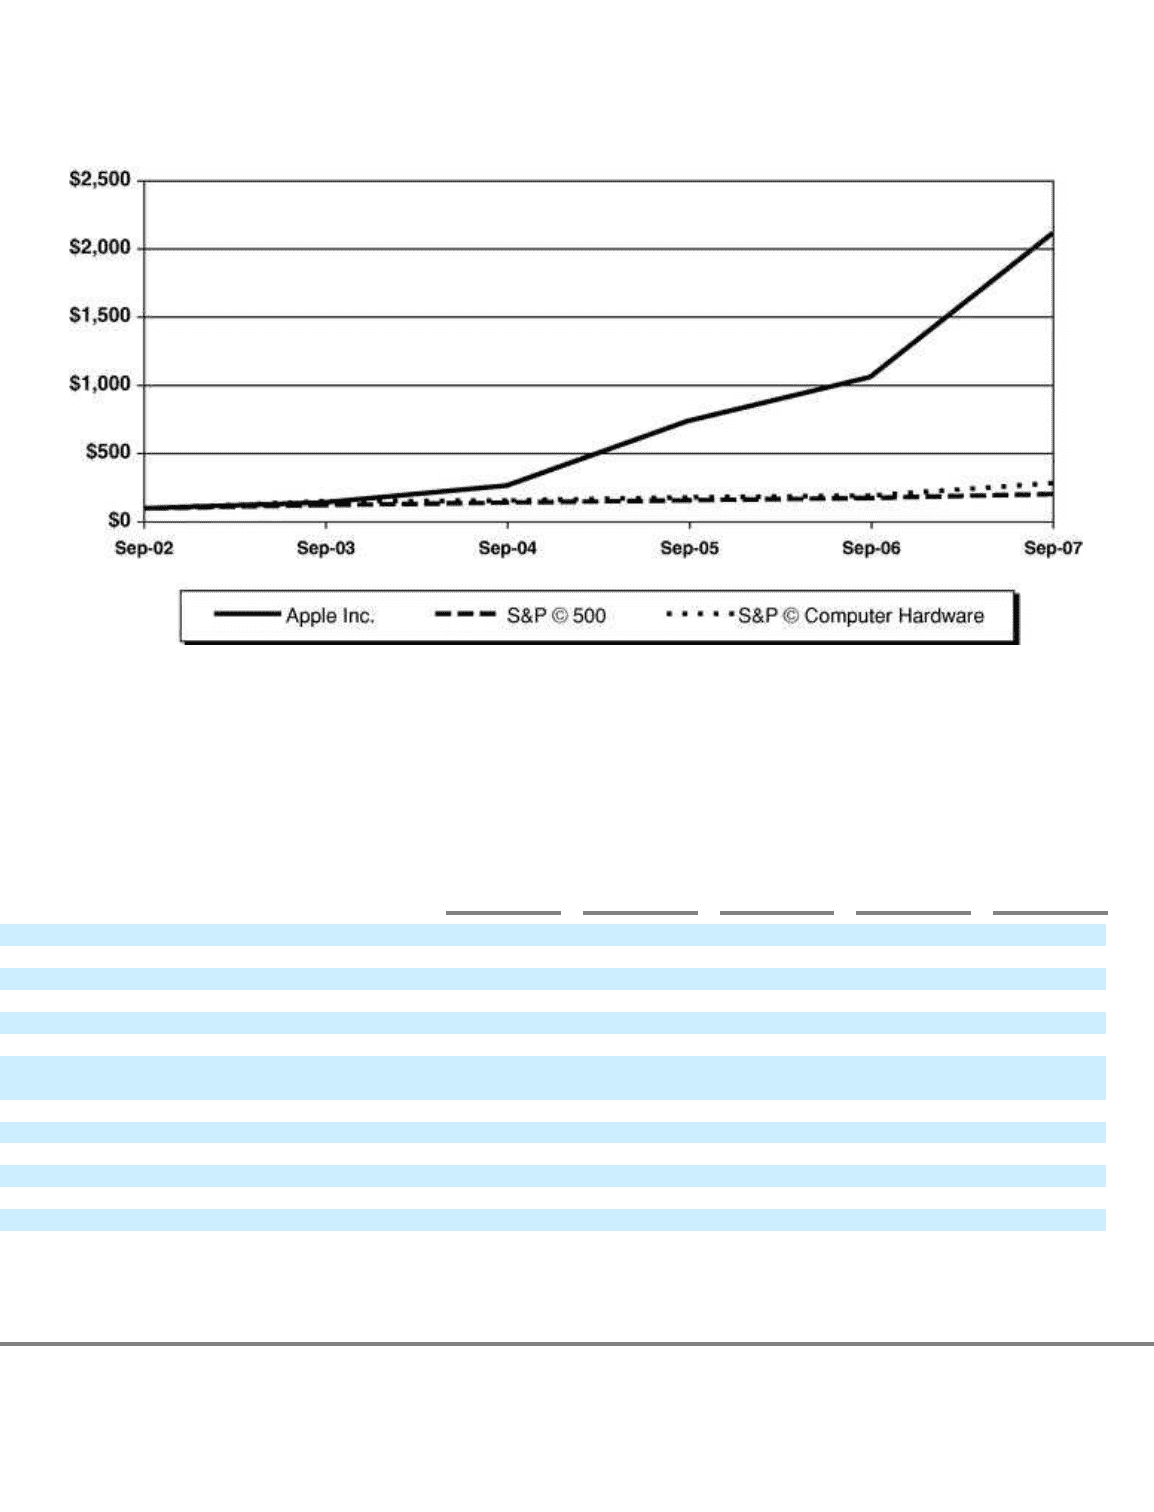
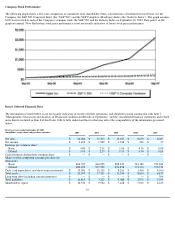
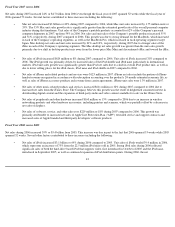
Company Stock Performance
The following graph shows a five-year comparison of cumulative total shareholder return, calculated on a dividend reinvested basis, for the
Company, the S&P 500 Composite Index (the "S&P 500") and the S&P Computers (Hardware) Index (the "Industry Index"). The graph assumes
$100 was invested in each of the Company's common stock, the S&P 500, and the Industry Index on September 30, 2002. Data points on the
graph are annual. Note that historic stock price performance is not necessarily indicative of future stock price performance.
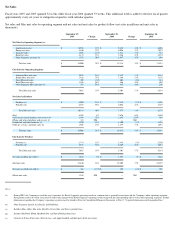
Item 6. Selected Financial Data
The information set forth below is not necessarily indicative of results of future operations, and should be read in conjunction with Item 7,
"Management's Discussion and Analysis of Financial Condition and Results of Operations" and the consolidated financial statements and related
notes thereto included in Item 8 of this Form 10-K to fully understand factors that may affect the comparability of the information presented
below.
35
Five fiscal years ended September 29, 2007
(In millions, except share and per share amounts)
2007
2006
2005
2004
2003
Net sales
$
24,006
$
19,315
$
13,931
$
8,279
$
6,207
Net income
$
3,496
$
1,989
$
1,328
$
266
$
57
Earnings per common share:
Basic
$
4.04
$
2.36
$
1.64
$
0.36
$
0.08
Diluted
$
3.93
$
2.27
$
1.55
$
0.34
$
0.08
Cash dividends declared per common share
$
—
$
—
$
—
$
—
$
—
Shares used in computing earnings per share (in
thousands):
Basic
864,595
844,058
808,439
743,180
721,262
Diluted
889,292
877,526
856,878
774,776
723,352
Cash, cash equivalents, and short
-
term investments
$
15,386
$
10,110
$
8,261
$
5,464
$
4,566
Total assets
$
25,347
$
17,205
$
11,516
$
8,039
$
6,817
Long
-
term debt (including current maturities)
$
—
$
—
$
—
$
—
$
304
Total liabilities
$
10,815
$
7,221
$
4,088
$
2,976
$
2,594
Shareholders' equity
$
14,532
$
9,984
$
7,428
$
5,063
$
4,223