Apple 2007 Annual Report Download - page 85
Download and view the complete annual report
Please find page 85 of the 2007 Apple annual report below. You can navigate through the pages in the report by either clicking on the pages listed below, or by using the keyword search tool below to find specific information within the annual report.-
 1
1 -
2
-
3
-
4
-
5
-
6
-
7
-
8
-
9
-
10
-
11
-
12
-
13
-
14
-
15
-
16
-
17
-
18
-
19
-
20
-
21
-
22
-
23
-
24
-
25
-
26
-
27
-
28
-
29
-
30
-
31
-
32
-
33
-
34
-
35
-
36
-
37
-
38
-
39
-
40
-
41
-
42
-
43
-
44
-
45
-
46
-
47
-
48
-
49
-
50
-
51
-
52
-
53
-
54
-
55
-
56
-
57
-
58
-
59
-
60
-
61
-
62
-
63
-
64
-
65
-
66
-
67
-
68
-
69
-
70
-
71
-
72
-
73
-
74
-
 75
75 -
 76
76 -
 77
77 -
 78
78 -
 79
79 -
 80
80 -
 81
81 -
 82
82 -
 83
83 -
 84
84 -
 85
85 -
 86
86 -
 87
87 -
 88
88 -
 89
89 -
 90
90 -
 91
91 -
 92
92 -
 93
93 -
 94
94 -
 95
95 -
96
-
97
-
98
-
99
-
100
-
101
-
102
-
103
-
104
-
105
-
106
-
107
-
108
-
109
-
110
-
111
-
112
-
113
-
114
-
115
-
116
-
117
-
118
-
119
-
120
-
121
-
122
-
123
-
124
-
125
-
126
-
127
-
128
-
129
-
130
-
131
-
132
-
133
-
134
-
135
-
136
-
137
-
138
-
139
-
140
-
141
-
142
-
143
-
144
-
145
-
146
-
147
-
148
-
149
-
150
-
151
-
152
-
153
-
154
-
155
-
156
-
157
-
158
-
159
-
160
-
161
-
162
-
163
-
164
-
165
-
166
-
167
-
168
 |
 |

Note 6
—
Shareholders' Equity (Continued)
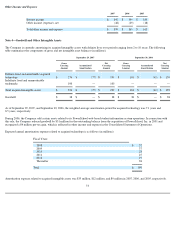
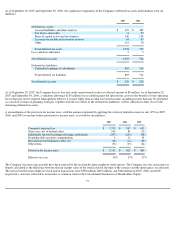
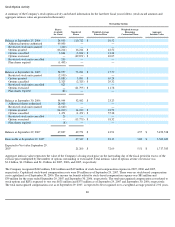
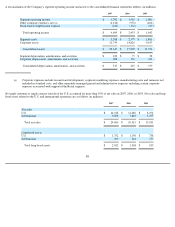
As of September 29, 2007, the Company had 4.7 million RSUs outstanding with a total grant-date fair value of $249 million that were excluded
from the options outstanding balances in the preceding table. The weighted-average grant date fair value of RSUs granted during 2007, 2006,
and 2005 was $88.51 per share, $70.92 per share, and $45.04 per share, respectively. Aggregate intrinsic value of RSUs was $701.3 million and
$262.5 million at September 29, 2007 and September 30, 2006, respectively. RSUs that vested during 2007 and 2006 totaled 45,000 and
2.47 million, respectively, and had a fair value of $6.1 million and $148.5 million, respectively, as of the vesting date. Shares of RSUs granted
after April 2005 have been deducted from the shares available for grant under the Company's stock option plans utilizing a factor of two times
the number of RSUs granted.
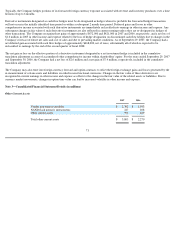
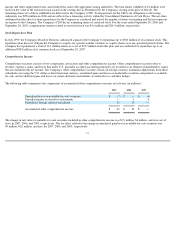
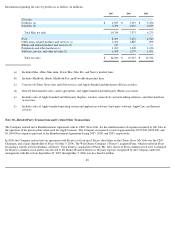
Note 7—Stock-Based Compensation
The Company has provided pro forma disclosures in Note 1 of the effect on net income and earnings per share for the year ended September 24,
2005 as if the fair value method of accounting for stock-based compensation had been used for its employee stock option grants and employee
stock purchase plan purchases. These pro forma effects have been estimated at the date of grant and beginning of the period, respectively, using
the BSM option-pricing model.
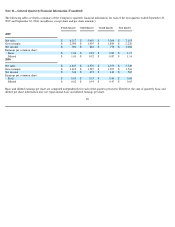
The Company uses the BSM option-pricing model to calculate the fair value of stock-based awards. The BSM option-
pricing model incorporates
various assumptions including expected volatility, expected life, and interest rates. The expected volatility is based on the historical volatility of
the Company's common stock over the most recent period commensurate with the estimated expected life of the Company's stock options and
other relevant factors including implied volatility in market traded options on the Company's common stock. The Company bases its expected
life assumption on its historical experience and on the terms and conditions of the stock awards it grants to employees. Stock-based
compensation cost is estimated at the grant date based on the award's fair-value as calculated by the BSM option-
pricing model and is recognized
as expense ratably on a straight-line basis over the requisite service period.
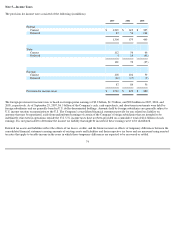
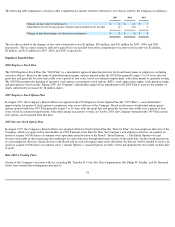
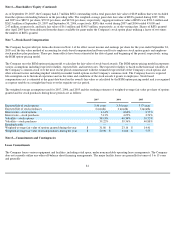
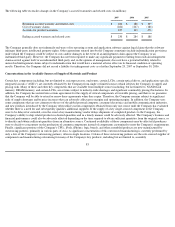
The weighted average assumptions used for 2007, 2006, and 2005 and the resulting estimates of weighted-
average fair value per share of options
granted and for stock purchases during those periods are as follows:
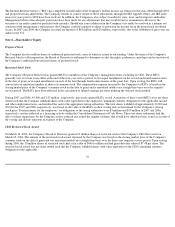
Note 8—Commitments and Contingencies
Lease Commitments
The Company leases various equipment and facilities, including retail space, under noncancelable operating lease arrangements. The Company
does not currently utilize any other off-balance sheet financing arrangements. The major facility leases are generally for terms of 3 to 15 years
and generally
81
2007
2006
2005
Expected life of stock options
3.46 years
3.56 years
3.57 years
Expected life of stock purchases
6 months
6 months
6 months
Interest rate
—
stock options
4.61
%
4.60
%
3.73
%
Interest rate
—
stock purchases
5.13
%
4.29
%
2.54
%
Volatility
—
stock options
38.13
%
40.34
%
39.52
%
Volatility
—
stock purchases
39.22
%
39.56
%
40.88
%
Dividend yields
—
—
—
Weighted
-
average fair value of options granted during the year
$
31.86
$
23.16
$
14.41
Weighted
-
average fair value of stock purchases during the year
$
20.90
$
14.06
$
7.55