Apple 2007 Annual Report Download - page 70
Download and view the complete annual report
Please find page 70 of the 2007 Apple annual report below. You can navigate through the pages in the report by either clicking on the pages listed below, or by using the keyword search tool below to find specific information within the annual report.-
 1
1 -
2
-
3
-
4
-
5
-
6
-
7
-
8
-
9
-
10
-
11
-
12
-
13
-
14
-
15
-
16
-
17
-
18
-
19
-
20
-
21
-
22
-
23
-
24
-
25
-
26
-
27
-
28
-
29
-
30
-
31
-
32
-
33
-
34
-
35
-
36
-
37
-
38
-
39
-
40
-
41
-
42
-
43
-
44
-
45
-
46
-
47
-
48
-
49
-
50
-
51
-
52
-
53
-
54
-
55
-
56
-
57
-
58
-
59
-
 60
60 -
 61
61 -
 62
62 -
 63
63 -
 64
64 -
 65
65 -
 66
66 -
 67
67 -
 68
68 -
 69
69 -
 70
70 -
 71
71 -
 72
72 -
 73
73 -
 74
74 -
 75
75 -
 76
76 -
 77
77 -
 78
78 -
 79
79 -
 80
80 -
81
-
82
-
83
-
84
-
85
-
86
-
87
-
88
-
89
-
90
-
91
-
92
-
93
-
94
-
95
-
96
-
97
-
98
-
99
-
100
-
101
-
102
-
103
-
104
-
105
-
106
-
107
-
108
-
109
-
110
-
111
-
112
-
113
-
114
-
115
-
116
-
117
-
118
-
119
-
120
-
121
-
122
-
123
-
124
-
125
-
126
-
127
-
128
-
129
-
130
-
131
-
132
-
133
-
134
-
135
-
136
-
137
-
138
-
139
-
140
-
141
-
142
-
143
-
144
-
145
-
146
-
147
-
148
-
149
-
150
-
151
-
152
-
153
-
154
-
155
-
156
-
157
-
158
-
159
-
160
-
161
-
162
-
163
-
164
-
165
-
166
-
167
-
168
 |
 |

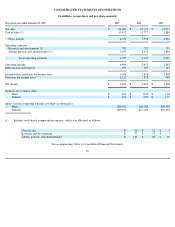
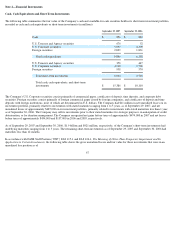
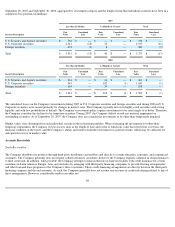
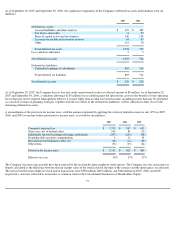
The following table sets forth the computation of basic and diluted earnings per share (in thousands, except net income and per share amounts):
Potentially dilutive securities representing 13.7 million, 3.9 million, and 12.7 million shares of common stock for the years ended September 29,
2007, September 30, 2006, and September 24, 2005, respectively, were excluded from the computation of diluted earnings per share for these
periods because their effect would have been antidilutive. These potentially dilutive securities include stock options, unvested restricted stock,
and RSUs.
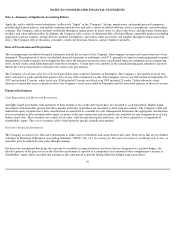
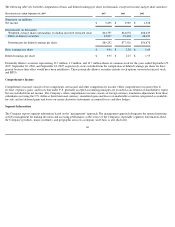
Comprehensive Income
Comprehensive income consists of two components, net income and other comprehensive income. Other comprehensive income refers to
revenue, expenses, gains, and losses that under U.S. generally accepted accounting principles are recorded as an element of shareholders' equity
but are excluded from net income. The Company's other comprehensive income consists of foreign currency translation adjustments from those
subsidiaries not using the U.S. dollar as their functional currency, unrealized gains and losses on marketable securities categorized as available-
for-sale, and net deferred gains and losses on certain derivative instruments accounted for as cash flow hedges.
Segment Information
The Company reports segment information based on the "management" approach. The management approach designates the internal reporting
used by management for making decisions and assessing performance as the source of the Company's reportable segments. Information about
the Company's products, major customers, and geographic areas on a company-wide basis is also disclosed.
66
Three fiscal years ended September 29, 2007
2007
2006
2005
Numerator (in millions):
Net income
$
3,496
$
1,989
$
1,328
Denominator (in thousands):
Weighted
-
average shares outstanding, excluding unvested restricted stock
864,595
844,058
808,439
Effect of dilutive securities
24,697
33,468
48,439
Denominator for diluted earnings per share
889,292
877,526
856,878
Basic earnings per share
$
4.04
$
2.36
$
1.64
Diluted earnings per share
$
3.93
$
2.27
$
1.55