Apple 2007 Annual Report Download - page 48
Download and view the complete annual report
Please find page 48 of the 2007 Apple annual report below. You can navigate through the pages in the report by either clicking on the pages listed below, or by using the keyword search tool below to find specific information within the annual report.-
 1
1 -
2
-
3
-
4
-
5
-
6
-
7
-
8
-
9
-
10
-
11
-
12
-
13
-
14
-
15
-
16
-
17
-
18
-
19
-
20
-
21
-
22
-
23
-
24
-
25
-
26
-
27
-
28
-
29
-
30
-
31
-
32
-
33
-
34
-
35
-
36
-
37
-
 38
38 -
 39
39 -
 40
40 -
 41
41 -
 42
42 -
 43
43 -
 44
44 -
 45
45 -
 46
46 -
 47
47 -
 48
48 -
 49
49 -
 50
50 -
 51
51 -
 52
52 -
 53
53 -
 54
54 -
 55
55 -
 56
56 -
 57
57 -
 58
58 -
59
-
60
-
61
-
62
-
63
-
64
-
65
-
66
-
67
-
68
-
69
-
70
-
71
-
72
-
73
-
74
-
75
-
76
-
77
-
78
-
79
-
80
-
81
-
82
-
83
-
84
-
85
-
86
-
87
-
88
-
89
-
90
-
91
-
92
-
93
-
94
-
95
-
96
-
97
-
98
-
99
-
100
-
101
-
102
-
103
-
104
-
105
-
106
-
107
-
108
-
109
-
110
-
111
-
112
-
113
-
114
-
115
-
116
-
117
-
118
-
119
-
120
-
121
-
122
-
123
-
124
-
125
-
126
-
127
-
128
-
129
-
130
-
131
-
132
-
133
-
134
-
135
-
136
-
137
-
138
-
139
-
140
-
141
-
142
-
143
-
144
-
145
-
146
-
147
-
148
-
149
-
150
-
151
-
152
-
153
-
154
-
155
-
156
-
157
-
158
-
159
-
160
-
161
-
162
-
163
-
164
-
165
-
166
-
167
-
168
 |
 |

sales per iPod unit sold decreased by 3% compared to 2005 primarily due to an overall decrease in average selling prices for all
iPods as well as a shift in product mix to the iPod nano.
•
Mac net sales increased $1.1 billion or 18% during 2006 compared to 2005. Mac unit sales increased by 769,000 units or 17%
during 2006 compared to 2005. These increases were mainly due to strong demand for the Intel-based MacBook and MacBook
Pro systems and reflect a shift in product mix to portable products in all of the Company's operating segments. Net sales and unit
sales of the Company's portable products increased 43% and 42%, respectively, during 2006 compared to 2005. Mac desktop net
sales and unit sales both decreased by 3% during 2006 compared to 2005. The decrease in sales of the Company's Mac desktops
was due to declines in sales of the Company's professional-oriented desktop products. The Company believes the decline in the
Company's professional-oriented desktop products was due to customers delaying purchases of such products in anticipation of
the release of the Intel-based Mac Pro, which did not begin shipping until August 2006, and updated software applications
capable of running on Intel-based Mac computers, and the trend toward portable computers. A slight increase of 1% during 2006
in net sales per Mac unit sold was due to a shift in mix to higher-priced portable products, partially offset by price reductions on
certain Mac systems.
•
Other music related products and services consists of sales associated with the iTunes Store and iPod services and accessories.
Net sales of other music related products and services increased $986 million or 110% during 2006 compared to 2005. The
increase was primarily due to increased net sales from the iTunes Store and Apple-branded and third-party iPod accessories and
services. The increase in sales from the iTunes Store stemmed from significant growth in U.S. sales and the opening of the iTunes
Store in Japan during August 2005 and Australia during October 2005. The increased sales from the iTunes Store were also
attributable to the availability of videos, television shows, and feature-length movie downloads.
•
Net sales of software, service, and other sales increased $188 million or 17% during 2006 compared to 2005. The growth was
primarily attributable to increased net sales of AppleCare Protection Plan ("APP") extended service and support contracts and
application software, partially offset by a decrease in sales of Mac OS X. Mac OS X sales were particularly high in 2005 due to
the release of Mac OS X Tiger in April 2005.
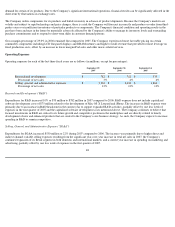
Offsetting the favorable factors discussed above, the Company's net sales during 2006 were negatively impacted by the following:
• Net sales of peripherals and other hardware declined $26 million or 2% compared to 2005 primarily due to price decreases and a
decrease in net sales of displays relating to a shift in mix from desktop to portable systems. The decrease in net sales of displays
for 2006 is consistent with the overall decrease in unit sales of Mac professional desktop systems.
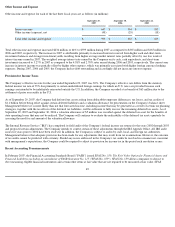
Segment Operating Performance
The Company manages its business primarily on a geographic basis. The Company's reportable operating segments consist of the Americas,
Europe, Japan, and Retail. The Americas, Europe, and Japan reportable segments do not include activities related to the Retail segment. The
Americas segment includes both North and South America. The Europe segment includes European countries as well as the Middle East and
Africa. The Retail segment operates Apple-owned retail stores in the U.S., Canada, Japan, the U.K. and Italy. Each reportable geographic
operating segment and the Retail operating segment provide similar hardware and software products and similar services. During 2007, the
Company revised the way it measures the Retail Segment's operating results to a manner that is generally consistent with the Company's other
operating segments. Prior period results have been reclassified to reflect this change to the Retail Segment's operating results along with the
corresponding offsets to the other operating segments. Further information regarding the Company's operating segments may be found in Note 9,
44