Apple 2007 Annual Report Download - page 92
Download and view the complete annual report
Please find page 92 of the 2007 Apple annual report below. You can navigate through the pages in the report by either clicking on the pages listed below, or by using the keyword search tool below to find specific information within the annual report.-
 1
1 -
2
-
3
-
4
-
5
-
6
-
7
-
8
-
9
-
10
-
11
-
12
-
13
-
14
-
15
-
16
-
17
-
18
-
19
-
20
-
21
-
22
-
23
-
24
-
25
-
26
-
27
-
28
-
29
-
30
-
31
-
32
-
33
-
34
-
35
-
36
-
37
-
38
-
39
-
40
-
41
-
42
-
43
-
44
-
45
-
46
-
47
-
48
-
49
-
50
-
51
-
52
-
53
-
54
-
55
-
56
-
57
-
58
-
59
-
60
-
61
-
62
-
63
-
64
-
65
-
66
-
67
-
68
-
69
-
70
-
71
-
72
-
73
-
74
-
75
-
76
-
77
-
78
-
79
-
80
-
81
-
 82
82 -
 83
83 -
 84
84 -
 85
85 -
 86
86 -
 87
87 -
 88
88 -
 89
89 -
 90
90 -
 91
91 -
 92
92 -
 93
93 -
 94
94 -
 95
95 -
 96
96 -
 97
97 -
 98
98 -
 99
99 -
 100
100 -
 101
101 -
 102
102 -
103
-
104
-
105
-
106
-
107
-
108
-
109
-
110
-
111
-
112
-
113
-
114
-
115
-
116
-
117
-
118
-
119
-
120
-
121
-
122
-
123
-
124
-
125
-
126
-
127
-
128
-
129
-
130
-
131
-
132
-
133
-
134
-
135
-
136
-
137
-
138
-
139
-
140
-
141
-
142
-
143
-
144
-
145
-
146
-
147
-
148
-
149
-
150
-
151
-
152
-
153
-
154
-
155
-
156
-
157
-
158
-
159
-
160
-
161
-
162
-
163
-
164
-
165
-
166
-
167
-
168
 |
 |
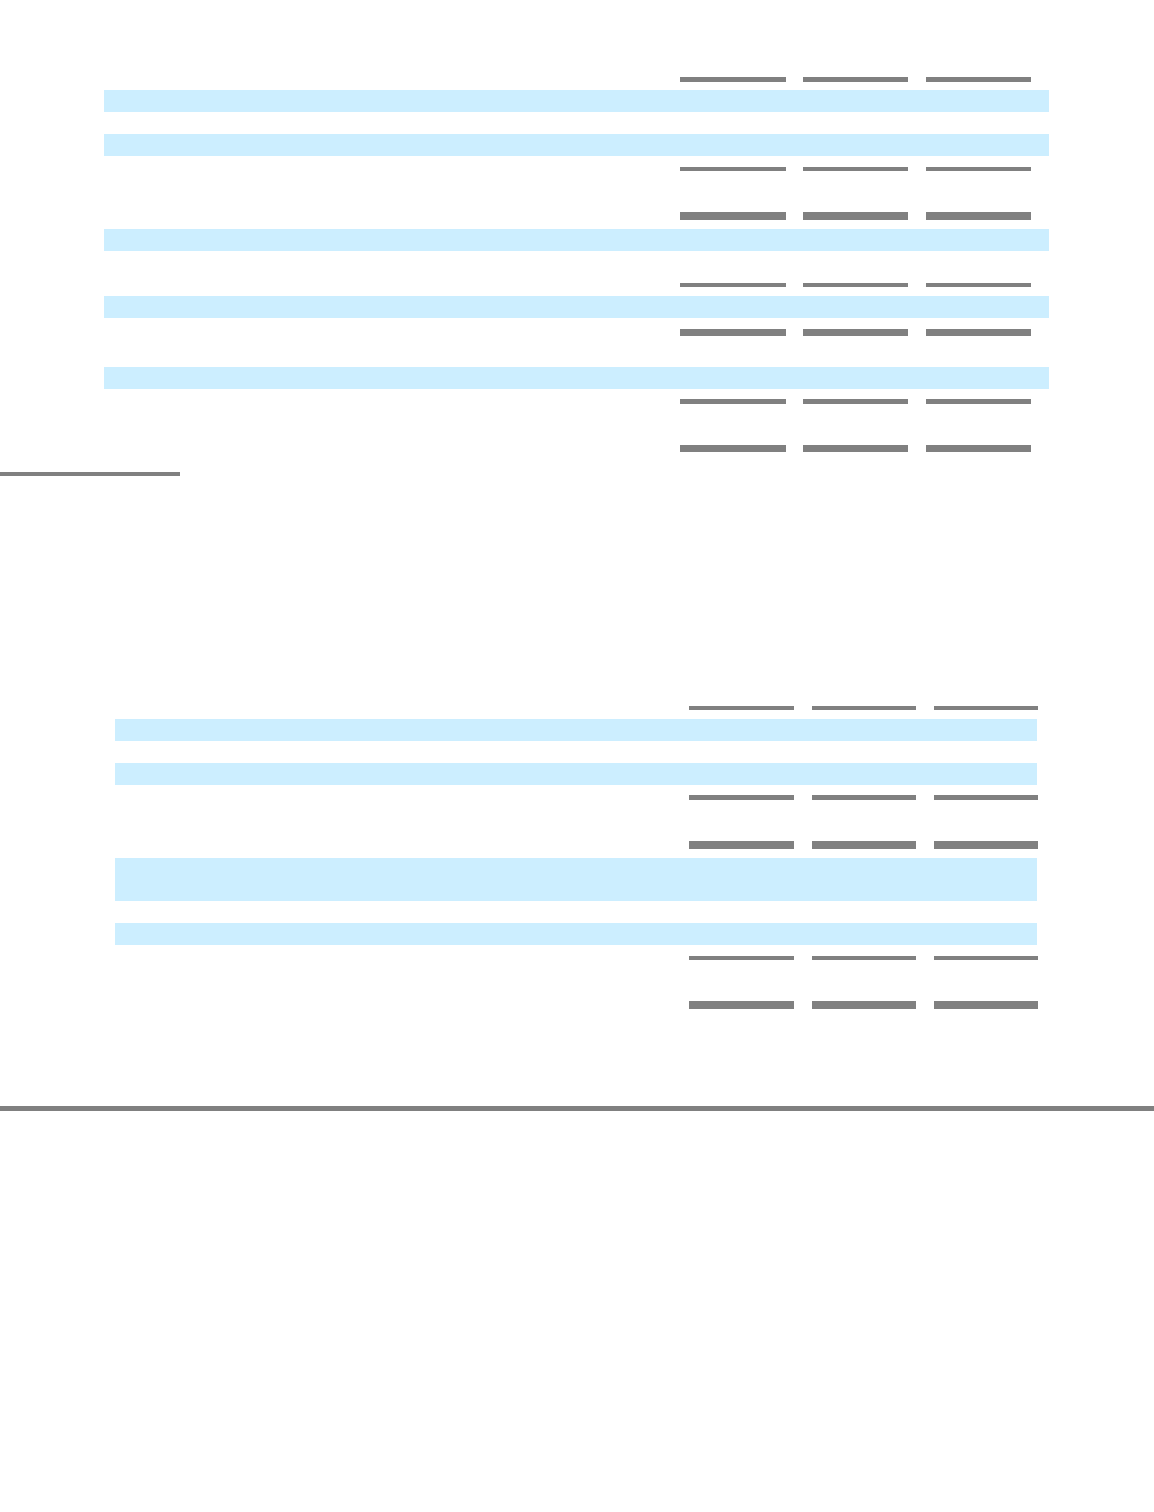
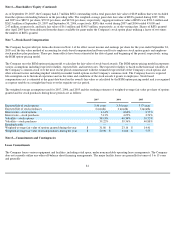
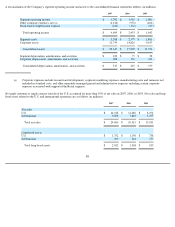
A reconciliation of the Company's segment operating income and assets to the consolidated financial statements follows (in millions):
(a)
2007
2006
2005
Segment operating income
$
5,792
$
3,569
$
2,096
Other corporate expenses, net (a)
(1,141
)
(953
)
(404
)
Stock
-
based compensation expense
(242
)
(163
)
(49
)
Total operating income
$
4,409
$
2,453
$
1,643
Segment assets
$
3,588
$
2,379
$
1,881
Corporate assets
21,759
14,826
9,635
Consolidated assets
$
25,347
$
17,205
$
11,516
Segment depreciation, amortization, and accretion
$
109
$
75
$
58
Corporate depreciation, amortization, and accretion
208
150
121
Consolidated depreciation, amortization, and accretion
$
317
$
225
$
179
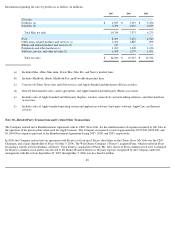
Corporate expenses include research and development, corporate marketing expenses, manufacturing costs and variances not
included in standard costs, and other separately managed general and administrative expenses including certain corporate
expenses associated with support of the Retail segment.
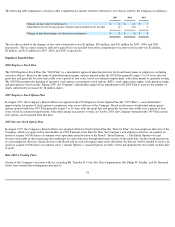
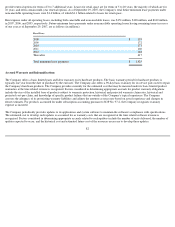
No single customer or single country outside of the U.S. accounted for more than 10% of net sales in 2007, 2006, or 2005. Net sales and long
-
lived assets related to the U.S. and international operations are as follows (in millions):
88
2007
2006
2005
Net sales:
U.S.
$
14,128
$
11,486
$
8,194
International
9,878
7,829
5,737
Total net sales
$
24,006
$
19,315
$
13,931
Long
-
lived assets:
U.S.
$
1,752
$
1,150
$
738
International
260
218
175
Total long
-
lived assets
$
2,012
$
1,368
$
913