Apple 2007 Annual Report Download - page 91
Download and view the complete annual report
Please find page 91 of the 2007 Apple annual report below. You can navigate through the pages in the report by either clicking on the pages listed below, or by using the keyword search tool below to find specific information within the annual report.-
 1
1 -
2
-
3
-
4
-
5
-
6
-
7
-
8
-
9
-
10
-
11
-
12
-
13
-
14
-
15
-
16
-
17
-
18
-
19
-
20
-
21
-
22
-
23
-
24
-
25
-
26
-
27
-
28
-
29
-
30
-
31
-
32
-
33
-
34
-
35
-
36
-
37
-
38
-
39
-
40
-
41
-
42
-
43
-
44
-
45
-
46
-
47
-
48
-
49
-
50
-
51
-
52
-
53
-
54
-
55
-
56
-
57
-
58
-
59
-
60
-
61
-
62
-
63
-
64
-
65
-
66
-
67
-
68
-
69
-
70
-
71
-
72
-
73
-
74
-
75
-
76
-
77
-
78
-
79
-
80
-
 81
81 -
 82
82 -
 83
83 -
 84
84 -
 85
85 -
 86
86 -
 87
87 -
 88
88 -
 89
89 -
 90
90 -
 91
91 -
 92
92 -
 93
93 -
 94
94 -
 95
95 -
 96
96 -
 97
97 -
 98
98 -
 99
99 -
 100
100 -
 101
101 -
102
-
103
-
104
-
105
-
106
-
107
-
108
-
109
-
110
-
111
-
112
-
113
-
114
-
115
-
116
-
117
-
118
-
119
-
120
-
121
-
122
-
123
-
124
-
125
-
126
-
127
-
128
-
129
-
130
-
131
-
132
-
133
-
134
-
135
-
136
-
137
-
138
-
139
-
140
-
141
-
142
-
143
-
144
-
145
-
146
-
147
-
148
-
149
-
150
-
151
-
152
-
153
-
154
-
155
-
156
-
157
-
158
-
159
-
160
-
161
-
162
-
163
-
164
-
165
-
166
-
167
-
168
 |
 |
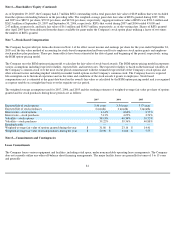
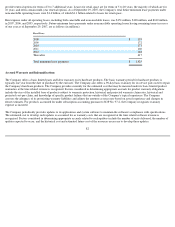
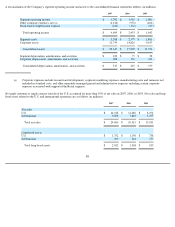
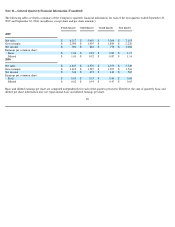
Summary information by operating segment follows (in millions):
(a)
2007
2006
2005
Americas:
Net sales
$
11,596
$
9,415
$
6,658
Operating income
$
2,949
$
1,899
$
970
Depreciation, amortization, and accretion
$
9
$
6
$
6
Segment assets (a)
$
1,497
$
896
$
705
Europe:
Net sales
$
5,460
$
4,096
$
3,073
Operating income
$
1,348
$
627
$
465
Depreciation, amortization, and accretion
$
6
$
4
$
4
Segment assets
$
595
$
471
$
289
Japan:
Net sales
$
1,082
$
1,211
$
924
Operating income
$
232
$
208
$
147
Depreciation, amortization, and accretion
$
3
$
3
$
3
Segment assets
$
159
$
181
$
165
Retail:
Net sales
$
4,115
$
3,246
$
2,278
Operating income
$
875
$
600
$
396
Depreciation, amortization, and accretion (b)
$
88
$
59
$
43
Segment assets (b)
$
1,085
$
651
$
589
Other Segments (c):
Net sales
$
1,753
$
1,347
$
998
Operating income
$
388
$
235
$
118
Depreciation, amortization, and accretion
$
3
$
3
$
2
Segment assets
$
252
$
180
$
133
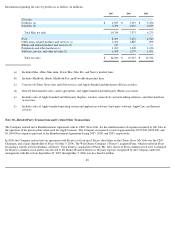
The Americas asset figures do not include fixed assets held in the U.S. Such fixed assets are not allocated specifically to the
Americas segment and are included in the corporate assets figures below.
(b)
Retail segment depreciation and asset figures reflect the cost and related depreciation of its retail stores and related infrastructure.
Retail store construction-in-progress, which is not subject to depreciation, is reflected in corporate assets.
(c) Other Segments include Asia-Pacific and FileMaker.
87