Apple 2007 Annual Report Download - page 62
Download and view the complete annual report
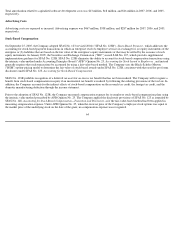
Please find page 62 of the 2007 Apple annual report below. You can navigate through the pages in the report by either clicking on the pages listed below, or by using the keyword search tool below to find specific information within the annual report.-
 1
1 -
2
-
3
-
4
-
5
-
6
-
7
-
8
-
9
-
10
-
11
-
12
-
13
-
14
-
15
-
16
-
17
-
18
-
19
-
20
-
21
-
22
-
23
-
24
-
25
-
26
-
27
-
28
-
29
-
30
-
31
-
32
-
33
-
34
-
35
-
36
-
37
-
38
-
39
-
40
-
41
-
42
-
43
-
44
-
45
-
46
-
47
-
48
-
49
-
50
-
51
-
 52
52 -
 53
53 -
 54
54 -
 55
55 -
 56
56 -
 57
57 -
 58
58 -
 59
59 -
 60
60 -
 61
61 -
 62
62 -
 63
63 -
 64
64 -
 65
65 -
 66
66 -
 67
67 -
 68
68 -
 69
69 -
 70
70 -
 71
71 -
 72
72 -
73
-
74
-
75
-
76
-
77
-
78
-
79
-
80
-
81
-
82
-
83
-
84
-
85
-
86
-
87
-
88
-
89
-
90
-
91
-
92
-
93
-
94
-
95
-
96
-
97
-
98
-
99
-
100
-
101
-
102
-
103
-
104
-
105
-
106
-
107
-
108
-
109
-
110
-
111
-
112
-
113
-
114
-
115
-
116
-
117
-
118
-
119
-
120
-
121
-
122
-
123
-
124
-
125
-
126
-
127
-
128
-
129
-
130
-
131
-
132
-
133
-
134
-
135
-
136
-
137
-
138
-
139
-
140
-
141
-
142
-
143
-
144
-
145
-
146
-
147
-
148
-
149
-
150
-
151
-
152
-
153
-
154
-
155
-
156
-
157
-
158
-
159
-
160
-
161
-
162
-
163
-
164
-
165
-
166
-
167
-
168
 |
 |
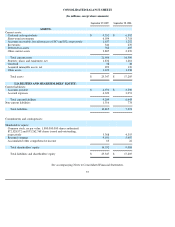
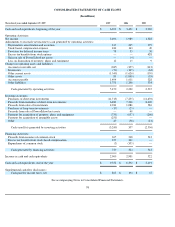
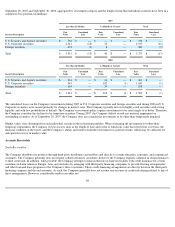
CONSOLIDATED STATEMENTS OF CASH FLOWS
(In millions)
See accompanying Notes to Consolidated Financial Statements.
58
Three fiscal years ended September 29, 2007
2007
2006
2005
Cash and cash equivalents, beginning of the year
$
6,392
$
3,491
$
2,969
Operating Activities:
Net income
3,496
1,989
1,328
Adjustments to reconcile net income to cash generated by operating activities:
Depreciation, amortization and accretion
317
225
179
Stock
-
based compensation expense
242
163
49
Provision for deferred income taxes
78
53
50
Excess tax benefits from stock options
—
—
428
Gain on sale of PowerSchool net assets
—
(
4
)
—
Loss on disposition of property, plant, and equipment
12
15
9
Changes in operating assets and liabilities:
Accounts receivable, net
(385
)
(357
)
(121
)
Inventories
(76
)
(105
)
(64
)
Other current assets
(1,540
)
(1,626
)
(150
)
Other assets
81
(1,040
)
(35
)
Accounts payable
1,494
1,611
328
Other liabilities
1,751
1,296
534
Cash generated by operating activities
5,470
2,220
2,535
Investing Activities:
Purchases of short
-
term investments
(11,719
)
(7,255
)
(11,470
)
Proceeds from maturities of short
-
term investments
6,483
7,226
8,609
Proceeds from sales of investments
2,941
1,086
586
Purchases of long
-
term investments
(17
)
(25
)
—
Proceeds from sale of PowerSchool net assets
—
40
—
Payment for acquisition of property, plant, and equipment
(735
)
(657
)
(260
)
Payment for acquisition of intangible assets
(251
)
—
—
Other
49
(58
)
(21
)
Cash (used for) generated by investing activities
(3,249
)
357
(2,556
)
Financing Activities:
Proceeds from issuance of common stock
365
318
543
Excess tax benefits from stock
-
based compensation
377
361
—
Repurchases of common stock
(3
)
(355
)
—
Cash generated by financing activities
739
324
543
Increase in cash and cash equivalents
2,960
2,901
522
Cash and cash equivalents, end of the year
$
9,352
$
6,392
$
3,491
Supplemental cash flow disclosures:
Cash paid for income taxes, net
$
863
$
194
$
17