Apple 2007 Annual Report Download - page 69
Download and view the complete annual report
Please find page 69 of the 2007 Apple annual report below. You can navigate through the pages in the report by either clicking on the pages listed below, or by using the keyword search tool below to find specific information within the annual report.-
 1
1 -
2
-
3
-
4
-
5
-
6
-
7
-
8
-
9
-
10
-
11
-
12
-
13
-
14
-
15
-
16
-
17
-
18
-
19
-
20
-
21
-
22
-
23
-
24
-
25
-
26
-
27
-
28
-
29
-
30
-
31
-
32
-
33
-
34
-
35
-
36
-
37
-
38
-
39
-
40
-
41
-
42
-
43
-
44
-
45
-
46
-
47
-
48
-
49
-
50
-
51
-
52
-
53
-
54
-
55
-
56
-
57
-
58
-
 59
59 -
 60
60 -
 61
61 -
 62
62 -
 63
63 -
 64
64 -
 65
65 -
 66
66 -
 67
67 -
 68
68 -
 69
69 -
 70
70 -
 71
71 -
 72
72 -
 73
73 -
 74
74 -
 75
75 -
 76
76 -
 77
77 -
 78
78 -
 79
79 -
80
-
81
-
82
-
83
-
84
-
85
-
86
-
87
-
88
-
89
-
90
-
91
-
92
-
93
-
94
-
95
-
96
-
97
-
98
-
99
-
100
-
101
-
102
-
103
-
104
-
105
-
106
-
107
-
108
-
109
-
110
-
111
-
112
-
113
-
114
-
115
-
116
-
117
-
118
-
119
-
120
-
121
-
122
-
123
-
124
-
125
-
126
-
127
-
128
-
129
-
130
-
131
-
132
-
133
-
134
-
135
-
136
-
137
-
138
-
139
-
140
-
141
-
142
-
143
-
144
-
145
-
146
-
147
-
148
-
149
-
150
-
151
-
152
-
153
-
154
-
155
-
156
-
157
-
158
-
159
-
160
-
161
-
162
-
163
-
164
-
165
-
166
-
167
-
168
 |
 |

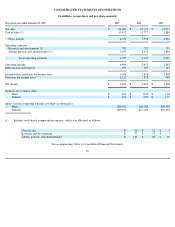
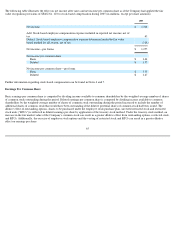
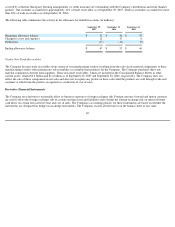
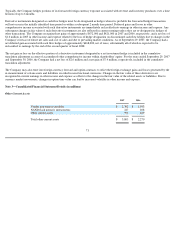
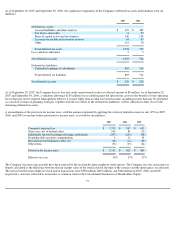
The following table illustrates the effect on net income after taxes and net income per common share as if the Company had applied the fair
value recognition provisions of SFAS No. 123 to stock-based compensation during 2005 (in millions, except per share amounts):
Further information regarding stock-based compensation can be found in Notes 6 and 7.
Earnings Per Common Share
Basic earnings per common share is computed by dividing income available to common shareholders by the weighted-average number of shares
of common stock outstanding during the period. Diluted earnings per common share is computed by dividing income available to common
shareholders by the weighted-average number of shares of common stock outstanding during the period increased to include the number of
additional shares of common stock that would have been outstanding if the dilutive potential shares of common stock had been issued. The
dilutive effect of outstanding options, shares to be purchased under the employee stock purchase plan, unvested restricted stock and restricted
stock units ("RSUs") is reflected in diluted earnings per share by application of the treasury stock method. Under the treasury stock method, an
increase in the fair market value of the Company's common stock can result in a greater dilutive effect from outstanding options, restricted stock,
and RSUs. Additionally, the exercise of employee stock options and the vesting of restricted stock and RSUs can result in a greater dilutive
effect on earnings per share.
65
2005
Net income
$
1,328
Add: Stock-based employee compensation expense included in reported net income, net of
tax
45
Deduct: Stock-based employee compensation expense determined under the fair value
based method for all awards, net of tax
(118
)
Net income
—
pro forma
$
1,255
Net income per common share
Basic
$
1.64
Diluted
$
1.55
Net income per common share
—
pro forma
Basic
$
1.55
Diluted
$
1.47