Apple 2007 Annual Report Download - page 60
Download and view the complete annual report
Please find page 60 of the 2007 Apple annual report below. You can navigate through the pages in the report by either clicking on the pages listed below, or by using the keyword search tool below to find specific information within the annual report.-
 1
1 -
2
-
3
-
4
-
5
-
6
-
7
-
8
-
9
-
10
-
11
-
12
-
13
-
14
-
15
-
16
-
17
-
18
-
19
-
20
-
21
-
22
-
23
-
24
-
25
-
26
-
27
-
28
-
29
-
30
-
31
-
32
-
33
-
34
-
35
-
36
-
37
-
38
-
39
-
40
-
41
-
42
-
43
-
44
-
45
-
46
-
47
-
48
-
49
-
 50
50 -
 51
51 -
 52
52 -
 53
53 -
 54
54 -
 55
55 -
 56
56 -
 57
57 -
 58
58 -
 59
59 -
 60
60 -
 61
61 -
 62
62 -
 63
63 -
 64
64 -
 65
65 -
 66
66 -
 67
67 -
 68
68 -
 69
69 -
 70
70 -
71
-
72
-
73
-
74
-
75
-
76
-
77
-
78
-
79
-
80
-
81
-
82
-
83
-
84
-
85
-
86
-
87
-
88
-
89
-
90
-
91
-
92
-
93
-
94
-
95
-
96
-
97
-
98
-
99
-
100
-
101
-
102
-
103
-
104
-
105
-
106
-
107
-
108
-
109
-
110
-
111
-
112
-
113
-
114
-
115
-
116
-
117
-
118
-
119
-
120
-
121
-
122
-
123
-
124
-
125
-
126
-
127
-
128
-
129
-
130
-
131
-
132
-
133
-
134
-
135
-
136
-
137
-
138
-
139
-
140
-
141
-
142
-
143
-
144
-
145
-
146
-
147
-
148
-
149
-
150
-
151
-
152
-
153
-
154
-
155
-
156
-
157
-
158
-
159
-
160
-
161
-
162
-
163
-
164
-
165
-
166
-
167
-
168
 |
 |

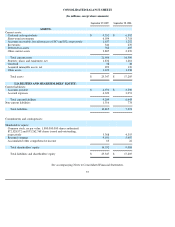
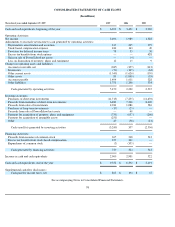
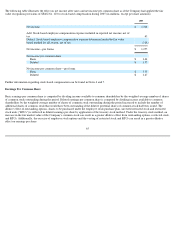
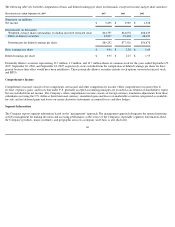
CONSOLIDATED STATEMENTS OF OPERATIONS
(In millions, except share and per share amounts)
(1)
Three fiscal years ended September 29, 2007
2007
2006
2005
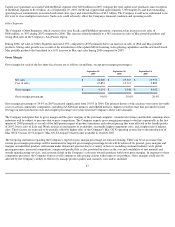
Net sales
$
24,006
$
19,315
$
13,931
Cost of sales (1)
15,852
13,717
9,889
Gross margin
8,154
5,598
4,042
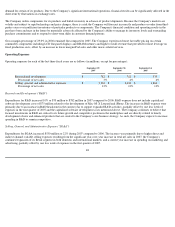
Operating expenses:
Research and development (1)
782
712
535
Selling, general, and administrative (1)
2,963
2,433
1,864
Total operating expenses
3,745
3,145
2,399
Operating income
4,409
2,453
1,643
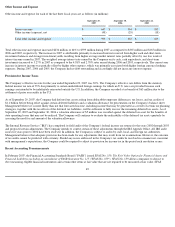
Other income and expense
599
365
165
Income before provision for income taxes
5,008
2,818
1,808
Provision for income taxes
1,512
829
480
Net income
$
3,496
$
1,989
$
1,328
Earnings per common share:
Basic
$
4.04
$
2.36
$
1.64
Diluted
$
3.93
$
2.27
$
1.55
Shares used in computing earnings per share (in thousands):
Basic
864,595
844,058
808,439
Diluted
889,292
877,526
856,878
Includes stock
-
based compensation expense, which was allocated as follows:
See accompanying Notes to Consolidated Financial Statements.
56
Cost of sales
$
35
$
21
$
3
Research and development
$
77
$
53
$
7
Selling, general, and administrative
$
130
$
89
$
39