Apple 2007 Annual Report Download - page 47
Download and view the complete annual report
Please find page 47 of the 2007 Apple annual report below. You can navigate through the pages in the report by either clicking on the pages listed below, or by using the keyword search tool below to find specific information within the annual report.-
 1
1 -
2
-
3
-
4
-
5
-
6
-
7
-
8
-
9
-
10
-
11
-
12
-
13
-
14
-
15
-
16
-
17
-
18
-
19
-
20
-
21
-
22
-
23
-
24
-
25
-
26
-
27
-
28
-
29
-
30
-
31
-
32
-
33
-
34
-
35
-
36
-
 37
37 -
 38
38 -
 39
39 -
 40
40 -
 41
41 -
 42
42 -
 43
43 -
 44
44 -
 45
45 -
 46
46 -
 47
47 -
 48
48 -
 49
49 -
 50
50 -
 51
51 -
 52
52 -
 53
53 -
 54
54 -
 55
55 -
 56
56 -
 57
57 -
58
-
59
-
60
-
61
-
62
-
63
-
64
-
65
-
66
-
67
-
68
-
69
-
70
-
71
-
72
-
73
-
74
-
75
-
76
-
77
-
78
-
79
-
80
-
81
-
82
-
83
-
84
-
85
-
86
-
87
-
88
-
89
-
90
-
91
-
92
-
93
-
94
-
95
-
96
-
97
-
98
-
99
-
100
-
101
-
102
-
103
-
104
-
105
-
106
-
107
-
108
-
109
-
110
-
111
-
112
-
113
-
114
-
115
-
116
-
117
-
118
-
119
-
120
-
121
-
122
-
123
-
124
-
125
-
126
-
127
-
128
-
129
-
130
-
131
-
132
-
133
-
134
-
135
-
136
-
137
-
138
-
139
-
140
-
141
-
142
-
143
-
144
-
145
-
146
-
147
-
148
-
149
-
150
-
151
-
152
-
153
-
154
-
155
-
156
-
157
-
158
-
159
-
160
-
161
-
162
-
163
-
164
-
165
-
166
-
167
-
168
 |
 |

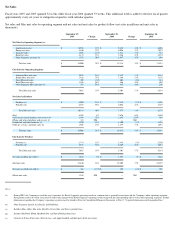
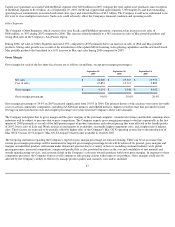
Fiscal Year 2007 versus 2006
Net sales during 2007 increased 24% or $4.7 billion from 2006 even though the fiscal year of 2007 spanned 52 weeks while the fiscal year of
2006 spanned 53 weeks. Several factors contributed to these increases including the following:
•
Mac net sales increased $3 billion or 40% during 2007 compared to 2006, while Mac unit sales increased by 1.75 million units or
33%. The 33% Mac unit sales growth rate is significantly greater than the estimated growth rate of the overall personal computer
industry during that timeframe. Unit sales of the Company's portable products accounted for 62% of the Company's personal
computer shipments in 2007, up from 54% in 2006. Net sales and unit sales of the Company's portable products increased 55%
and 51%, respectively, during 2007 compared to 2006. This growth was due to strong demand for the MacBook, which increased
in each of the Company's operating segments, as well as the MacBook Pro, which increased in each operating segment except
Japan. Mac desktop net sales and unit sales increased by 21% and 12%, respectively, during 2007 due to stronger sales of the
iMac in each of the Company's operating segments. The Mac desktop net sales growth was greater than the unit sales growth
primarily due to a shift in desktop product mix away from the lower-
price Mac Mini and discontinued eMac and toward the iMac.
• Net sales of iPods increased $629 million or 8% during 2007 compared to 2006. Unit sales of iPods increased 31% compared to
2006. The iPod growth was primarily driven by increased sales of the iPod shuffle and iPod nano particularly in international
markets. iPod unit sales growth was significantly greater than iPod net sales due to a shift in overall iPod product mix, as well as
due to lower selling prices for the iPod classic, iPod nano and iPod shuffle in 2007 compared to 2006.
•
Net sales of iPhone and related products and services were $123 million in 2007. iPhone net sales include the portion of iPhone
handset revenue recognized in accordance with subscription accounting over the product's 24-month estimated economic life, as
well as sales of iPhone accessory products and revenue from carrier agreements. iPhone unit sales were 1.39 million in 2007.
•
Net sales of other music related products and services increased $611 million or 32% during 2007 compared to 2006 due to
increased net sales from the iTunes Store. The Company believes this growth was the result of heightened consumer interest in
downloading digital content and the expansion of third-party audio and video content available for sale via the iTunes Store.
•
Net sales of peripherals and other hardware increased $160 million or 15% compared to 2006 due to an increase in wireless
networking products and other hardware accessories, including printers and scanners, which was partially offset by a decrease in
net sales of displays.
•
Net sales of software, service, and other sales rose $229 million or 18% during 2007 compared to 2006. This growth was
primarily attributable to increased net sales of AppleCare Protection Plan ("APP") extended service and support contracts and
increased sales of Apple branded and third-party developers' software products.
Fiscal Year 2006 versus 2005
Net sales during 2006 increased 39% or $5.4 billion from 2005. This increase was due in part to the fact that 2006 spanned 53 weeks while 2005
spanned 52 weeks. Several other factors contributed to these increases including the following:
• Net sales of iPods increased $3.1 billion or 69% during 2006 compared to 2005. Unit sales of iPods totaled 39.4 million in 2006,
which represents an increase of 75% from the 22.5 million iPod units sold in 2005. Strong iPod sales during 2006 reflected
significant sales of both the hard-drive based iPod that supports video, first introduced in October of 2005 and the iPod nano,
introduced in September 2005, as well as continued expansion of iPod distribution points. During 2006, the net
43