Electronic Arts 2000 Annual Report Download - page 16
Download and view the complete annual report
Please find page 16 of the 2000 Electronic Arts annual report below. You can navigate through the pages in the report by either clicking on the pages listed below, or by using the keyword search tool below to find specific information within the annual report.-
 1
1 -
2
-
3
-
4
-
5
-
 6
6 -
 7
7 -
 8
8 -
 9
9 -
 10
10 -
 11
11 -
 12
12 -
 13
13 -
 14
14 -
 15
15 -
 16
16 -
 17
17 -
 18
18 -
 19
19 -
 20
20 -
 21
21 -
 22
22 -
 23
23 -
 24
24 -
 25
25 -
 26
26 -
27
-
28
-
29
-
30
-
31
-
32
-
33
-
34
-
35
-
36
-
37
-
38
-
39
-
40
-
41
-
42
-
43
-
44
-
45
-
46
-
47
-
48
-
49
-
50
-
51
-
52
-
53
-
54
-
55
-
56
-
57
-
58
-
59
-
60
-
61
-
62
-
63
-
64
-
65
-
66
-
67
-
68
-
69
-
70
-
71
-
72
 |
 |

MD&A
14
This Annual Report, including the “Letter to Stockholders” at pages 1 to 3 and the following “Management’s Discussion and
Analysis of Financial Condition and Results of Operations”, contains forward-looking statements about circumstances that have
not yet occurred. All statements, trend analysis and other information contained below relating to markets, our products and
trends in revenue, as well as other statements including words such as “anticipate”, “believe” or “expect” and statements in
the future tense are forward-looking statements. These forward-looking statements are subject to business and economic risks
and actual events or our actual future results could differ materially from those set forth in the forward-looking statements due
to such risks and uncertainties. We will not necessarily update information if any forward-looking statement later turns out to
be inaccurate. Risks and uncertainties that may affect out future results and performance include, but are not limited to those
discussed under the heading “Risk Factors” at page 32 of this Annual Report and under the same heading in our Annual Report
on Form 10-K for the year ended March 31, 2000.
RESULTS OF OPERATIONS
Comparison of Fiscal 2000 to 1999:
Revenues
We derive revenues primarily from shipments of entertainment software, which includes EA Studio products for dedicated
entertainment systems (that we call video game systems or consoles such as PlayStation and Nintendo 64), EA Studio per-
sonal computer products (or PC), and Affiliated Label (or AL) products that are published by third parties and distributed or
co-published by us. We also derive revenues from licensing of EA Studio products and Affiliated Label products through hard-
ware companies (or OEMs) and online subscription revenues.
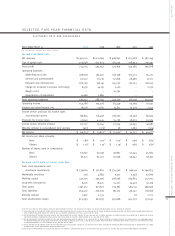
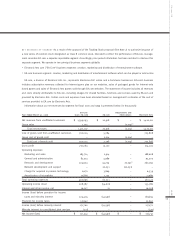
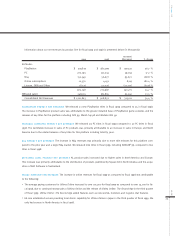
Information about our net revenues for North America and foreign areas for fiscal 2000 and 1999 is summarized below
(in thousands):
2000 1999 Increase % change
North America $ 846,637 $ 704,998 $ 141,639 20.1 %
Europe 492,430 443,937 48,493 10.9 %
Asia Pacific 47,573 39,560 8,013 20.3 %
Japan 33,371 33,368 3 0.0 %
International 573,374 516,865 56,509 10.9 %
Consolidated Net Revenues $ 1,420,011 $ 1,221,863 $ 198,148 16.2 %
NORTH AMERICA NET REVENUES The increase in North America net revenues for fiscal 2000 compared to fiscal 1999 was pri-
marily attributable to:
•A52% increase in PC revenues due to strong sales of
Command and Conquer: Tiberian Sun, Sim City 3000
as well as the
fourth quarter shipment of
The Sims
in fiscal 2000.
•A20% increase in PlayStation revenues due to more titles released during fiscal 2000 including
Madden NFL 2000, NBA
2000
and
Tomorrow Never Dies
as compared to fiscal 1999.
•A17% increase in AL revenues primarily due to the shipment of titles published by Square EA offset by the loss of an affili-
ate, Accolade, due to its acquisition by a third party in the first quarter of the current fiscal year.
•These increases were partially offset by an expected decline in sales of Nintendo 64 (“N64”) products.
MANAGEMENT’S DISCUSSION AND ANALYSIS
OF FINANCIAL CONDITION AND RESULTS OF OPERATIONS
ELECTRONIC ARTS AND SUBSIDIARIES