Electronic Arts 2000 Annual Report Download - page 26
Download and view the complete annual report
Please find page 26 of the 2000 Electronic Arts annual report below. You can navigate through the pages in the report by either clicking on the pages listed below, or by using the keyword search tool below to find specific information within the annual report.-
 1
1 -
2
-
3
-
4
-
5
-
6
-
7
-
8
-
9
-
10
-
11
-
12
-
13
-
14
-
15
-
 16
16 -
 17
17 -
 18
18 -
 19
19 -
 20
20 -
 21
21 -
 22
22 -
 23
23 -
 24
24 -
 25
25 -
 26
26 -
 27
27 -
 28
28 -
 29
29 -
 30
30 -
 31
31 -
 32
32 -
 33
33 -
 34
34 -
 35
35 -
 36
36 -
37
-
38
-
39
-
40
-
41
-
42
-
43
-
44
-
45
-
46
-
47
-
48
-
49
-
50
-
51
-
52
-
53
-
54
-
55
-
56
-
57
-
58
-
59
-
60
-
61
-
62
-
63
-
64
-
65
-
66
-
67
-
68
-
69
-
70
-
71
-
72
 |
 |

LICENSE, OEM AND OTHER REVENUES The decrease in license, OEM, online and other revenues was primarily due to the following:
•Net revenues derived from 32-bit products other than PlayStation decreased primarily due to lower sales of Sega Saturn®
products. We released no new Sega Saturn titles in fiscal 1999 compared to eight in fiscal 1998.
•Net revenues generated by 16-bit video game cartridge-based products decreased in fiscal 1999 as compared to fiscal 1998. As
the 16-bit video game market has been replaced by 32-bit and 64-bit systems, we did not release any new titles in fiscal 1999.
•Licensing of EA Studio products increased primarily as a result of an increase in the revenues generated by licensing of our
products in Europe.
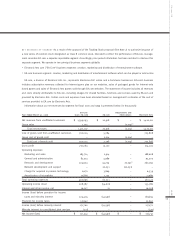
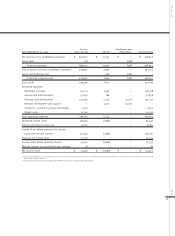
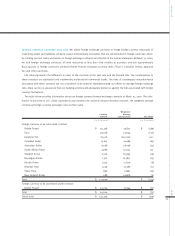
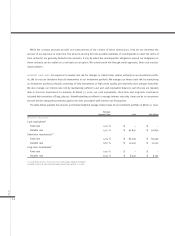
NET REVENUES BY SEGMENT Information about our net revenues by segment for fiscal 1999 and 1998 is presented below
(in thousands):
EA Core Adjustments and
Year Ended March 31, 1999 (excl. EA.com) EA.com Eliminations Electronic Arts
Net revenues from unaffiliated customers $ 1,204,689 $ 17,174 $ – $ 1,221,863
Group sales 985 – (985)(a) –
Total net revenues 1,205,674 17,174 (985) 1,221,863
Cost of goods sold from unaffiliated customers 624,252 3,571 – 627,823
Group cost of goods sold – 985 (985) –
Total cost of goods sold 624,252 4,556 (985) 627,823
Gross profit 581,422 12,618 – 594,040
Operating expenses:
Marketing and sales 161,029 2,378 – 163,407
General and administrative 74,995 1,224 – 76,219
Research and development 181,245 8,050 9,846(b) 199,141
Network development and support – 9,846 (9,846) –
Charge for acquired in-process technology 44,115 – – 44,115
Amortization of intangibles 5,880 – – 5,880
Total operating expenses 467,264 21,498 – 488,762
Operating income (loss) 114,158 (8,880) – 105,278
Interest and other income, net 13,180 – – 13,180
Income (loss) before provision for income
taxes and minority interest 127,338 (8,880) – 118,458
Provision for income taxes 45,414 – – 45,414
Income (loss) before minority interest 81,924 (8,880) – 73,044
Minority interest in consolidated joint venture (172) – – (172)
Net income (loss) $ 81,752 $ (8,880) $ – $ 72,872
MD&A
24