Electronic Arts 2000 Annual Report Download - page 36
Download and view the complete annual report
Please find page 36 of the 2000 Electronic Arts annual report below. You can navigate through the pages in the report by either clicking on the pages listed below, or by using the keyword search tool below to find specific information within the annual report.-
 1
1 -
2
-
3
-
4
-
5
-
6
-
7
-
8
-
9
-
10
-
11
-
12
-
13
-
14
-
15
-
16
-
17
-
18
-
19
-
20
-
21
-
22
-
23
-
24
-
25
-
 26
26 -
 27
27 -
 28
28 -
 29
29 -
 30
30 -
 31
31 -
 32
32 -
 33
33 -
 34
34 -
 35
35 -
 36
36 -
 37
37 -
 38
38 -
 39
39 -
 40
40 -
 41
41 -
 42
42 -
 43
43 -
 44
44 -
 45
45 -
 46
46 -
47
-
48
-
49
-
50
-
51
-
52
-
53
-
54
-
55
-
56
-
57
-
58
-
59
-
60
-
61
-
62
-
63
-
64
-
65
-
66
-
67
-
68
-
69
-
70
-
71
-
72
 |
 |

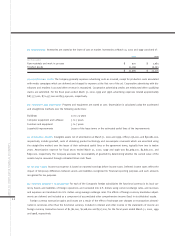
While the contract amounts provide one measurement of the volume of these transactions, they do not represent the
amount of our exposure to credit risk. The amounts (arising from the possible inabilities of counterparties to meet the terms of
their contracts) are generally limited to the amounts, if any, by which the counterparties’ obligations exceed our obligations as
these contracts can be settled on a net basis at our option. We control credit risk through credit approvals, limits and monitor-
ing procedures.
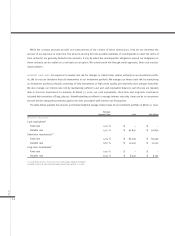
INTEREST RATE RISK Our exposure to market rate risk for changes in interest rates relates primarily to our investment portfo-
lio. We do not use derivative financial instruments in our investment portfolio. We manage our interest rate risk by maintaining
an investment portfolio primarily consisting of debt instruments of high credit quality and relatively short average maturities.
We also manage our interest rate risk by maintaining sufficient cash and cash equivalent balances such that we are typically
able to hold our investments to maturity. At March 31, 2000, our cash equivalents, short-term and long-term investments
included debt securities of $194,769,000. Notwithstanding our efforts to manage interest rate risks, there can be no assurances
that we will be adequately protected against the risks associated with interest rate fluctuations.
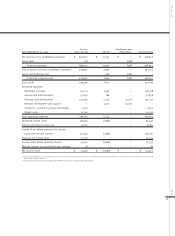
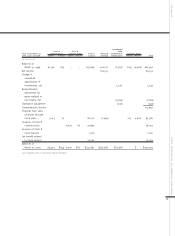
The table below presents the amounts and related weighted average interest rates of our investment portfolio at March 31, 2000:
Average
Interest Rate Cost Fair Value
(Dollars in thousands)
Cash equivalents(1)
Fixed rate 0.00 % $ – $ –
Variable rate 4.15 % $ 92,830 $ 92,830
Short-term investments(1)(2)
Fixed rate 4.05 % $ 83,639 $ 83,539
Variable rate 6.87 % $ 10,000 $ 10,000
Long-term investments(1)
Fixed rate 0.00 % $ – $ –
Variable rate 6.35 % $ 8,400 $ 8,162
(1) SEE DEFINITION IN NOTE 1 OF THE NOTES TO THE CONSOLIDATED FINANCIAL STATEMENTS.
(2) MATURITY DATES FOR SHORT-TERM INVESTMENTS RANGE FROM 6 MONTHS TO 3 YEARS.
MD&A
34