Electronic Arts 2000 Annual Report Download - page 9
Download and view the complete annual report
Please find page 9 of the 2000 Electronic Arts annual report below. You can navigate through the pages in the report by either clicking on the pages listed below, or by using the keyword search tool below to find specific information within the annual report.-
 1
1 -
 2
2 -
 3
3 -
 4
4 -
 5
5 -
 6
6 -
 7
7 -
 8
8 -
 9
9 -
 10
10 -
 11
11 -
 12
12 -
 13
13 -
 14
14 -
 15
15 -
 16
16 -
 17
17 -
 18
18 -
 19
19 -
 20
20 -
21
-
22
-
23
-
24
-
25
-
26
-
27
-
28
-
29
-
30
-
31
-
32
-
33
-
34
-
35
-
36
-
37
-
38
-
39
-
40
-
41
-
42
-
43
-
44
-
45
-
46
-
47
-
48
-
49
-
50
-
51
-
52
-
53
-
54
-
55
-
56
-
57
-
58
-
59
-
60
-
61
-
62
-
63
-
64
-
65
-
66
-
67
-
68
-
69
-
70
-
71
-
72
 |
 |

07
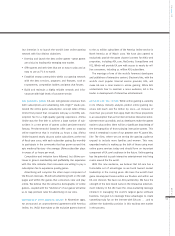
EA PUBLISHING EA 2000 AR
EA PUBLISHING
BRAND MARKETING ON A GLOBAL SCALE
As the world’s largest publisher of interactive entertainment software for the PC and console
(PlayStation and Nintendo®64) markets, EA drives our products to market like no other company.
EA localizes, manufactures, packages, distributes, markets and sells titles created by our Studios,
as well as by some third-party game developer partners, in over 75 countries on five continents.
EA’s size and reach, coupled with our ability to produce games for any console or platform, gives
us a unique position in the industry.
EA is the No.1 publisher in most western markets, including the United States and Europe, as
well as in most markets in Asia Pacific.
EA Publishing Strengths
Our greatest strength lies in the quality of our publishing teams in North America, in nearly every
western European country, in Japan and across most Asia-Pacific markets, including Australia,
China and Korea. Highly successful, these outstanding teams manage a prodigious portfolio of
products for both the console and PC entertainment software markets.
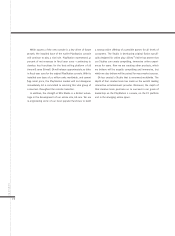
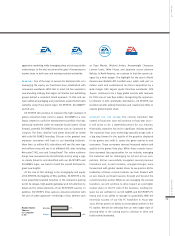
12
3
4
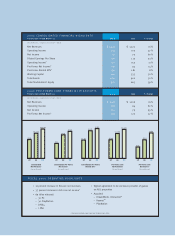
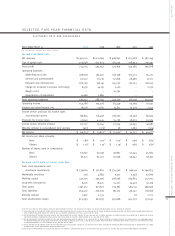
REVENUE MIX PERCENTAGE
BY GEOGRAPHY
00 99
1North America 60 58
2Europe 35 36
3Asia Pacific 3 3
4Japan 2 3
1
2
3
4
5
REVENUE MIX PERCENTAGE
BY PLATFORM
00 99
1PlayStation 41 43
2PC-CD 28 22
3EADistribution 19 20
4N64 9 12
5License, OEM
& Other 3 3