Electronic Arts 2000 Annual Report Download - page 55
Download and view the complete annual report
Please find page 55 of the 2000 Electronic Arts annual report below. You can navigate through the pages in the report by either clicking on the pages listed below, or by using the keyword search tool below to find specific information within the annual report.-
 1
1 -
2
-
3
-
4
-
5
-
6
-
7
-
8
-
9
-
10
-
11
-
12
-
13
-
14
-
15
-
16
-
17
-
18
-
19
-
20
-
21
-
22
-
23
-
24
-
25
-
26
-
27
-
28
-
29
-
30
-
31
-
32
-
33
-
34
-
35
-
36
-
37
-
38
-
39
-
40
-
41
-
42
-
43
-
44
-
 45
45 -
 46
46 -
 47
47 -
 48
48 -
 49
49 -
 50
50 -
 51
51 -
 52
52 -
 53
53 -
 54
54 -
 55
55 -
 56
56 -
 57
57 -
 58
58 -
 59
59 -
 60
60 -
 61
61 -
 62
62 -
 63
63 -
 64
64 -
 65
65 -
66
-
67
-
68
-
69
-
70
-
71
-
72
 |
 |

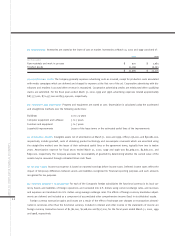
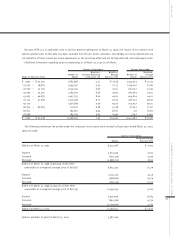
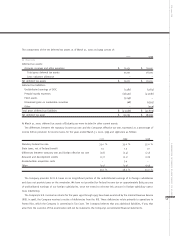
Because SFAS 123 is applicable only to options granted subsequent to March 31, 1995, the impact of non-vested stock
options granted prior to this date has been excluded from the pro forma calculation. Accordingly, pro forma adjustments are
not indicative of future period pro forma adjustments as the pro forma effect will not be fully reflected until subsequent years.
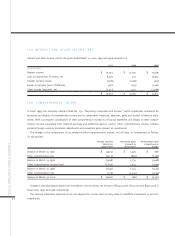
Additional information regarding options outstanding as of March 31, 2000 is as follows:
Options Outstanding Options Exercisable
Weighted- Weighted- Weighted-
Number of Average Remaining Average Number of Average
Range of Exercise Prices Shares Contractual Life Exercise Price Shares Exercise Price
$1.990 – $ 23.500 1,684,898 4.21 $ 16.48 1,444,433 $ 15.34
23.750 – 29.875 1,544,350 6.52 27.37 1,144,030 27.66
30.000 – 35.000 1,524,245 6.97 34.15 653,137 33.49
35.063 – 43.125 1,263,602 8.08 39.64 365,063 40.01
43.625 – 46.875 1,467,705 8.62 44.61 404,804 44.12
47.125 – 57.938 1,025,608 8.77 50.62 208,722 49.82
59.750 1,826,819 9.39 59.75 205,977 59.75
66.375 – 83.875 761,102 9.68 74.38 20,293 72.67
87.813 185,600 9.93 87.81 56 87.81
91.938 183,025 9.65 91.94 7,147 91.94
$1.990 – $ 91.938 11,466,954 7.65 $ 42.60 4,453,662 $ 29.86
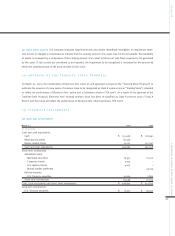
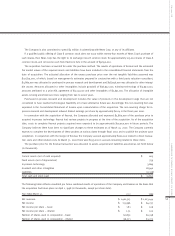
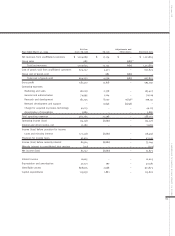
The following summarizes the activity under the Company’s stock option plans during the fiscal years ended March 31, 2000,
1999 and 1998:
Options Outstanding
Weighted-Average
Shares Exercise Price
Balance at March 31, 1997 8,323,568 $ 21.97
Granted 3,833,539 32.92
Canceled (616,275) 37.96
Exercised (1,688,702) 18.92
Balance at March 31, 1998 (3,961,559 shares were
exercisable at a weighted average price of $18.83) 9,852,130 25.76
Granted 3,147,216 44.18
Canceled (568,983) 34.74
Exercised (991,104) 22.73
Balance at March 31, 1999 (5,094,075 shares were
exercisable at a weighted average price of $22.79) 11,439,259 30.65
Granted 3,907,976 63.84
Canceled (860,586) 43.36
Exercised (3,019,695) 24.83
Balance at March 31, 2000 11,466,954 $ 42.60
Options available for grant at March 31, 2000 3,582,266
EA 2000 AR
53
NOTES TO CONSOLIDATED FINANCIAL STATEMENTS