Electronic Arts 2000 Annual Report Download - page 64
Download and view the complete annual report
Please find page 64 of the 2000 Electronic Arts annual report below. You can navigate through the pages in the report by either clicking on the pages listed below, or by using the keyword search tool below to find specific information within the annual report.-
 1
1 -
2
-
3
-
4
-
5
-
6
-
7
-
8
-
9
-
10
-
11
-
12
-
13
-
14
-
15
-
16
-
17
-
18
-
19
-
20
-
21
-
22
-
23
-
24
-
25
-
26
-
27
-
28
-
29
-
30
-
31
-
32
-
33
-
34
-
35
-
36
-
37
-
38
-
39
-
40
-
41
-
42
-
43
-
44
-
45
-
46
-
47
-
48
-
49
-
50
-
51
-
52
-
53
-
 54
54 -
 55
55 -
 56
56 -
 57
57 -
 58
58 -
 59
59 -
 60
60 -
 61
61 -
 62
62 -
 63
63 -
 64
64 -
 65
65 -
 66
66 -
 67
67 -
 68
68 -
 69
69 -
 70
70 -
 71
71 -
 72
72
 |
 |

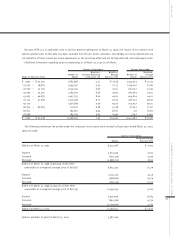
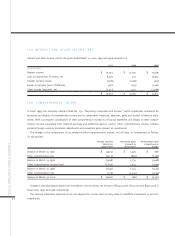
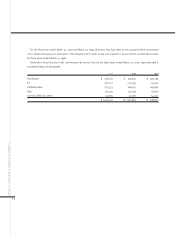
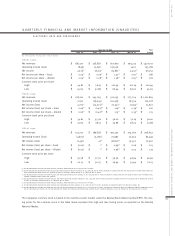
Information about Electronic Arts business segments is presented below for the fiscal years ended March 31, 2000, 1999,
1998 (in thousands):
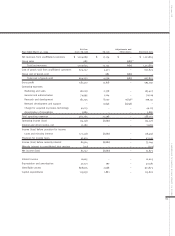
EA Core Adjustments and
Year Ended March 31, 2000 (excl. EA.com) EA.com Eliminations Electronic Arts
Net revenues from unaffiliated customers $ 1,399,093 $ 20,918 $ – $ 1,420,011
Group sales 2,014 – (2,014)(a) –
Total net revenues 1,401,107 20,918 (2,014) 1,420,011
Cost of goods sold from unaffiliated customers 700,024 5,784 – 705,808
Group cost of goods sold – 2,014 (2,014) –
Total cost of goods sold 700,024 7,798 (2,014) 705,808
Gross profit 701,083 13,120 – 714,203
Operating expenses:
Marketing and sales 185,714 2,914 – 188,628
General and administrative 87,513 4,989 – 92,502
Research and development 205,933 34,775 20,051(b) 260,759
Network development and support – 20,051 (20,051) –
Charge for acquired in-process technology 2,670 3,869 – 6,539
Amortization of intangibles 10,866 1,123 – 11,989
Total operating expenses 492,696 67,721 – 560,417
Operating income (loss) 208,387 (54,601) – 153,786
Interest and other income, net 16,017 11 – 16,028
Income (loss) before provision for income
taxes and minority interest 224,404 (54,590) – 169,814
Provision for income taxes 52,642 – – 52,642
Income (loss) before minority interest 171,762 (54,590) – 117,172
Minority interest in consolidated joint venture (421) – – (421)
Net income (loss) 171,341 (54,590) – 116,751
Interest income 13,733 11 – 13,744
Depreciation and amortization 39,818 6,907 – 46,725
Identifiable assets 1,085,411 106,901 – 1,192,312
Capital expenditures 97,279 37,605 – 134,884
NOTES TO CONSOLIDATED FINANCIAL STATEMENTS
62