Electronic Arts 2000 Annual Report Download - page 69
Download and view the complete annual report
Please find page 69 of the 2000 Electronic Arts annual report below. You can navigate through the pages in the report by either clicking on the pages listed below, or by using the keyword search tool below to find specific information within the annual report.-
 1
1 -
2
-
3
-
4
-
5
-
6
-
7
-
8
-
9
-
10
-
11
-
12
-
13
-
14
-
15
-
16
-
17
-
18
-
19
-
20
-
21
-
22
-
23
-
24
-
25
-
26
-
27
-
28
-
29
-
30
-
31
-
32
-
33
-
34
-
35
-
36
-
37
-
38
-
39
-
40
-
41
-
42
-
43
-
44
-
45
-
46
-
47
-
48
-
49
-
50
-
51
-
52
-
53
-
54
-
55
-
56
-
57
-
58
-
 59
59 -
 60
60 -
 61
61 -
 62
62 -
 63
63 -
 64
64 -
 65
65 -
 66
66 -
 67
67 -
 68
68 -
 69
69 -
 70
70 -
 71
71 -
 72
72
 |
 |

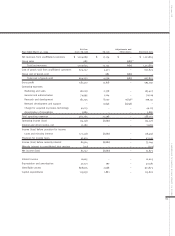
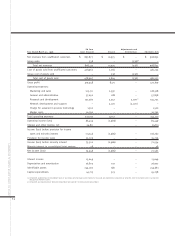
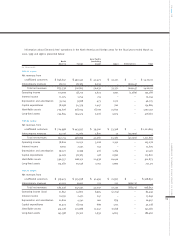
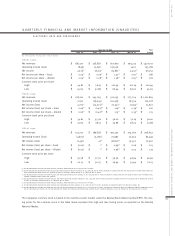
Quarter Ended Year
June 30 Sept. 30 Dec. 31 March 31 Ended
(In thousands, except per share data)
FISCAL 2000:
Net revenues $ 186,120 $ 338,887 $ 600,691 $ 294,313 $ 1,420,011
Operating income (loss) (849) 23,697 129,536 1,402 153,786
Net income 2,326(a) 18,132(a) 92,861(a) 3,432(b) 116,751
Net income per share – basic $ 0.04(a) $0.29(a) $1.47(a) $0.05(b) $1.86
Net income per share – diluted $ 0.04(a) $0.28(a) $1.38(a) $0.05(b) $1.76
Common stock price per share
High $ 54.81 $ 76.19 $ 120.94 $ 102.19 $ 120.94
Low $ 45.63 $ 52.88 $ 66.44 $ 69.00 $ 45.63
FISCAL 1999:
Net revenues $ 178,221 $ 245,763 $ 520,155 $ 277,724 $ 1,221,863
Operating income (loss) 3,050 (29,545) 102,439 29,334 105,278
Net income (loss) 3,700(c) (25,273)(d) 72,531(e) 21,914(e) 72,872
Net income (loss) per share – basic $ 0.06(c) $(0.42)(d) $1.19(e) $0.36(e) $1.20
Net income (loss) per share – diluted $ 0.06(c) $(0.42)(d) $1.15(e) $0.35(e) $1.15
Common stock price per share
High $ 54.81 $ 55.56 $ 56.00 $ 52.19 $ 56.00
Low $ 41.63 $ 38.13 $ 33.88 $ 38.25 $ 33.88
FISCAL 1998:
Net revenues $ 123,712 $ 189,828 $ 391,245 $ 204,067 $ 908,852
Operating income (loss) (4,807) (3,080) 70,983 20,353 83,449
Net income (loss) (1,451) 41(f) 58,620(g) 15,352 72,562
Net income (loss) per share – basic $ (0.02) $ –(f) $0.99(g) $0.26 $ 1.23
Net income (loss) per share – diluted $ (0.02) $ –(f) $0.96(g) $0.25 $ 1.19
Common stock price per share
High $ 35.38 $ 37.50 $ 39.56 $ 46.94 $ 46.94
Low $ 20.13 $ 30.75 $ 29.94 $ 34.94 $ 20.13
(a) NET INCOME AND NET INCOME PER SHARE INCLUDE GOODWILL AMORTIZATION OF $1.8 MILLION, NET OF TAXES.
(b) NET INCOME AND NET INCOME PER SHARE INCLUDE ONE-TIME ACQUISITION RELATED CHARGES OF $4.5 MILLION, NET OF TAXES, INCURRED IN CONNECTION WITH THE ACQUISITION OF KESMAI AND OTHER BUSI-
NESS COMBINATIONS MADE DURING THE QUARTER AS WELL AS GOODWILL AMORTIZATION OF $2.9 MILLION, NET OF TAXES.
(c) NET INCOME AND NET INCOME PER SHARE INCLUDE ONE-TIME ACQUISITION RELATED CHARGES OF $1.6 MILLION, NET OF TAXES, INCURRED IN CONNECTION WITH THE ACQUISITION OF TWO SOFTWARE DEVEL-
OPMENT COMPANIES MADE DURING THE QUARTER.
(d) NET INCOME AND NET INCOME PER SHARE INCLUDE ONE-TIME ACQUISITION RELATED CHARGES OF $35.9 MILLION, NET OF TAXES, INCURRED IN CONNECTION WITH THE ACQUISITION OF WESTWOOD STUDIOS
AS WELL AS GOODWILL AMORTIZATION OF $0.6 MILLION, NET OF TAXES.
(e) NET INCOME AND NET INCOME PER SHARE INCLUDE GOODWILL AMORTIZATION OF $1.7 MILLION, NET OF TAXES.
(f) NET INCOME AND NET INCOME PER SHARE INCLUDE ONE-TIME MERGER RELATED CHARGES OF $7.2 MILLION, NET OF TAXES, INCURRED IN CONNECTION WITH THE MERGER OF MAXIS, INC.
(g) NET INCOME AND NET INCOME PER SHARE INCLUDE ONE-TIME ACQUISITION RELATED CHARGES OF $1.0 MILLION, NET OF TAXES, INCURRED IN CONNECTION WITH THE REMAINING MINORITY OWNERSHIP INTER-
EST IN ELECTRONIC ARTS VICTOR, INC. NET INCOME AND NET INCOME PER SHARE INCLUDE A ONE-TIME GAIN ON SALE OF CREATIVE WONDERS. LLC IN THE AMOUNT OF $8.5 MILLION, NET OF TAXES.
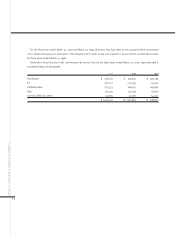
The Company’s common stock is traded in the over-the-counter market under the Nasdaq Stock Market symbol ERTS. The clos-
ing prices for the common stock in the table above represent the high and low closing prices as reported on the Nasdaq
National Market.
EA 2000 AR
67
QUARTERLY FINANCIAL AND MARKET INFORMATION (UNAUDITED)
QUARTERLY FINANCIAL AND MARKET INFORMATION (UNAUDITED)
ELECTRONIC ARTS AND SUBSIDIARIES